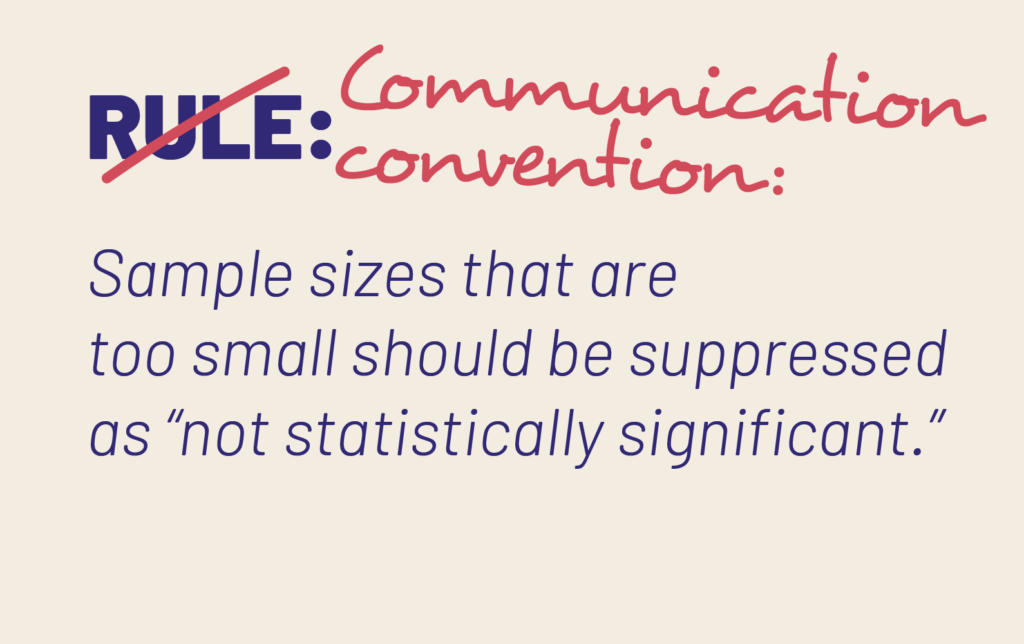
I want to talk to you about why you should stop saying “not statistically significant” based on sample size alone.
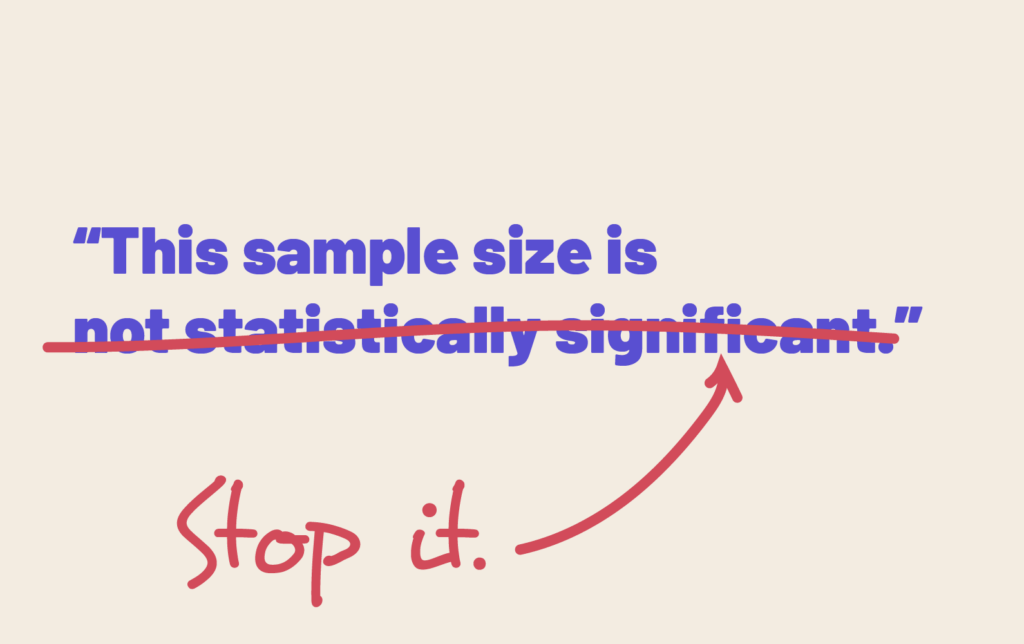
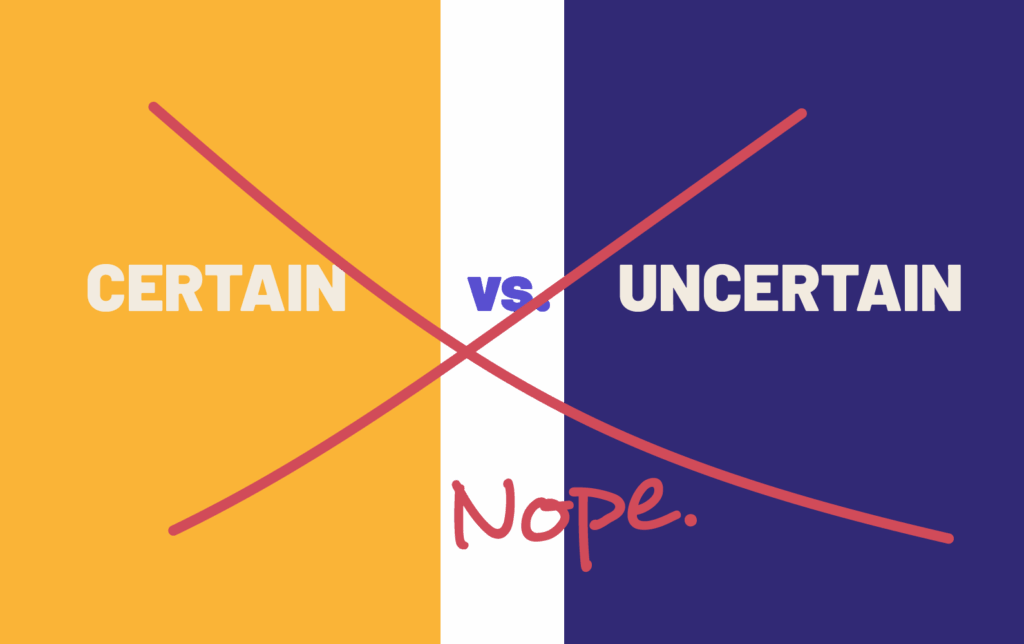
The term “not statistically significant” should only be applied to a hypothesis, not a sample size, and even then it’s an arbitrary line we’ve drawn to lump results into a false dichotomy of “certain” or “uncertain”, instead of talking about what level of uncertainty we are actually dealing with.

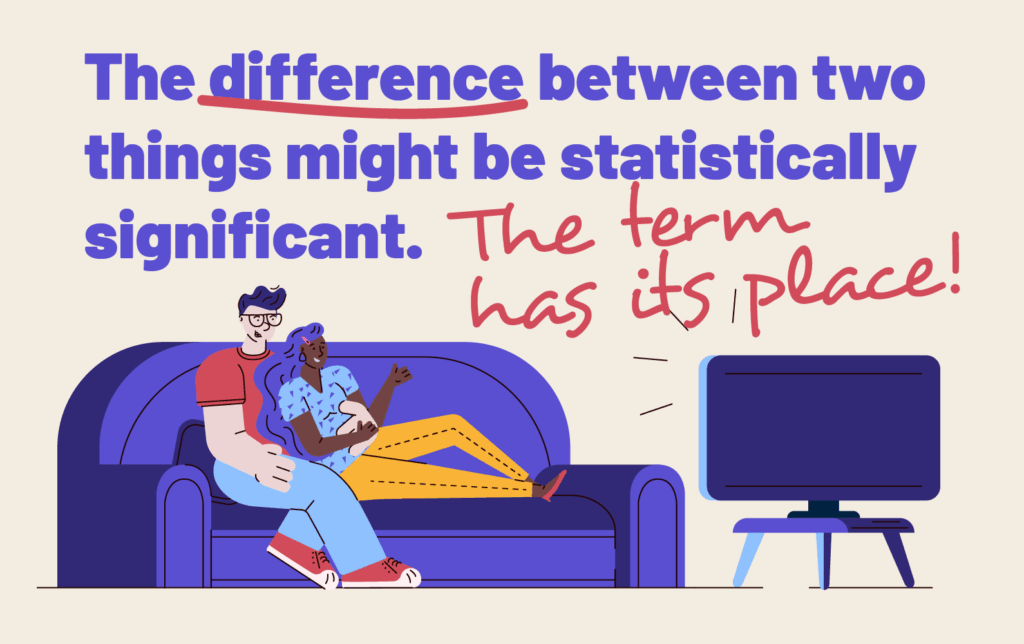
“Statistical significance” relates to how strongly the data you have can disprove your hypothesis.
Let’s say we have a survey about how much people like the finale episode of the Sopranos on a scale from 1-10. One of the hypotheses we’re trying to disprove is that men liked the episode more than women. We sample some people out of the millions who watched the episode. Depending on the amount of answers we have, the kind of answers we have, and the variance between answers, the difference between between men and women may or may not be “statistically significant”; a cutoff drawn somewhere along the line from very certain to totally uncertain. In this case, the term is being applied to the significance of the difference.
But there’s another way that people use “not statistically significant” all the time that is absolutely unhelpful, hurtful and down right incorrect.
In these cases it’s used as a communication convention, a shortcut norm to save people from having to engage with higher amounts of uncertainty. It’s when people have a small sample size and they decide that they are so uncertain about how well these results will accurately reflect the entire population that they declare the results of that sample “not statistically significant”.
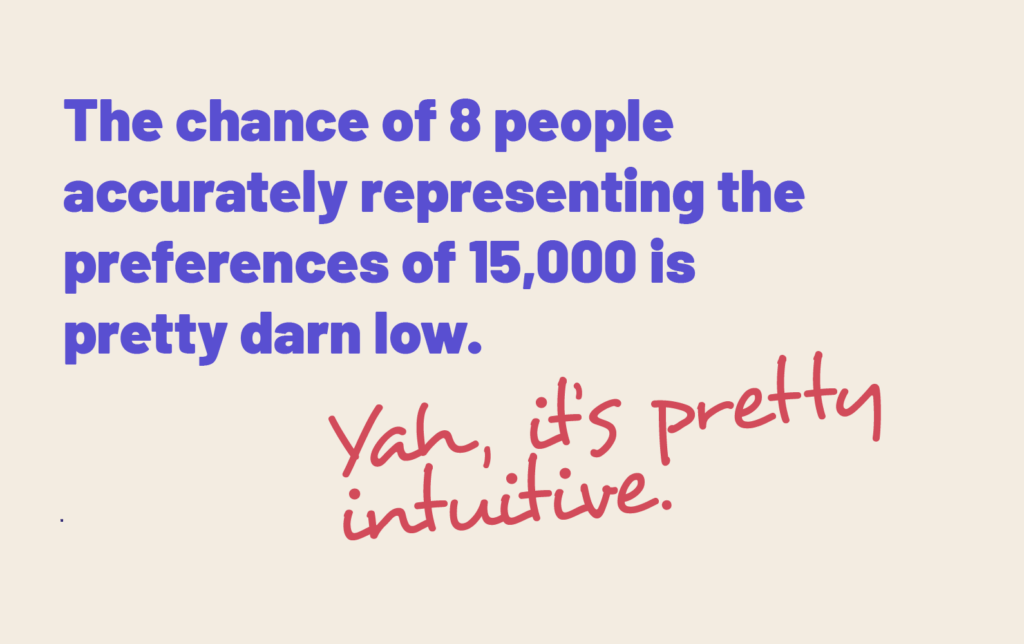
This is very intuitive, for example if there are 15,000 people living in a town and the town council is trying to decide whether their citizens want a new park or a new pool, if they surveyed only 8 of them, even if 7 out of 8 respondents said they want a pool, they might not feel all that confident about how accurately those results reflect the entire town. A sample of 8 people for a population of 15,000 is very small when it comes to statistics.
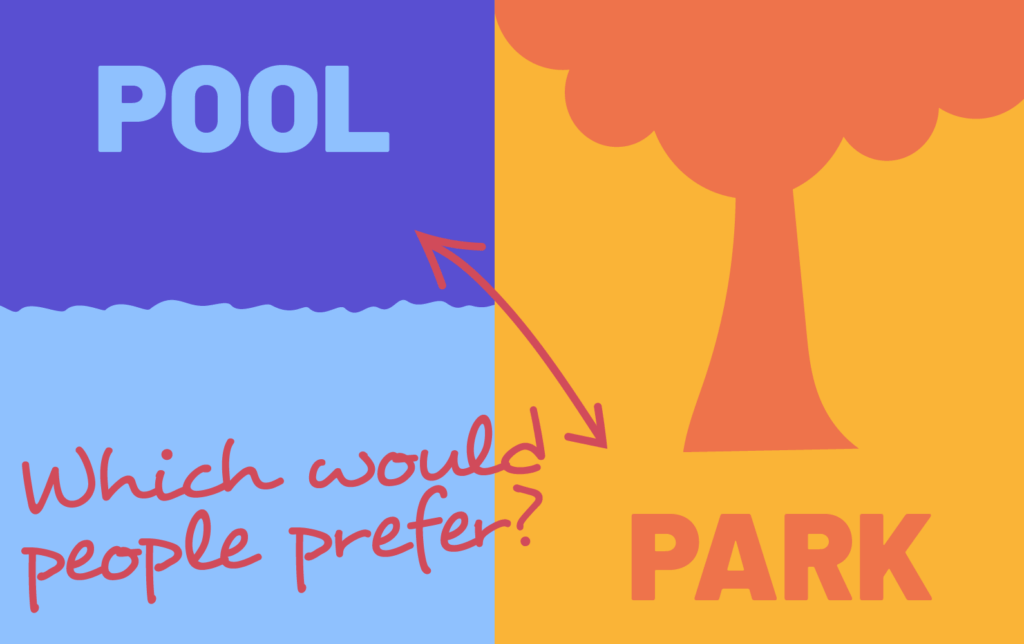
If another councillor managed to get a sample of 1,000 town residents out of 15,000 and 63% of them said they want a pool, that number can be considered much more reliable. We can say we are more certain that these results might reflect the opinion of the entire town. Now of course sample selection, representativeness, and many other factors affect certainty and samples, but right now we’re just talking about certainty and sample size.
In our first example, 7 out of 8 or 88% of respondents said they wanted a pool. Is it ok for the councilor to put in his report that his “study shows 88% of people in the town will likely prefer a pool”? Not if that’s all he says, no. Because though 88% of the people he asked did prefer a pool, his sample was so small that there’s a very, very high degree of uncertainty about whether those few results will accurately reflect all of the townspeople.
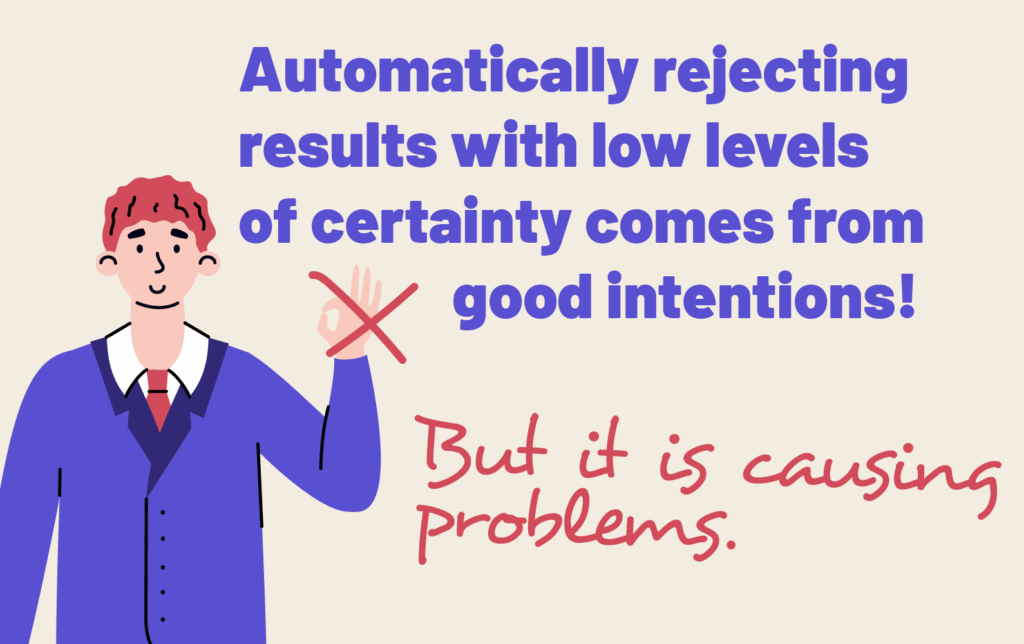
This is why the communication convention (remember not a mathematical rule, but a communication convention) of saying “not statistically significant” started. It was a norm or a tradition that developed to keep people honest about the reliability of their information. The councilor who only asked 8 people has such a small sample size that we’re taught to say his result is “not statistically significant” and he should say so.
But there’s a problem with that. What if he asks 10 people? What if he asks 100 people? What if he asks 2000 people? When does a sample become statistically significant?
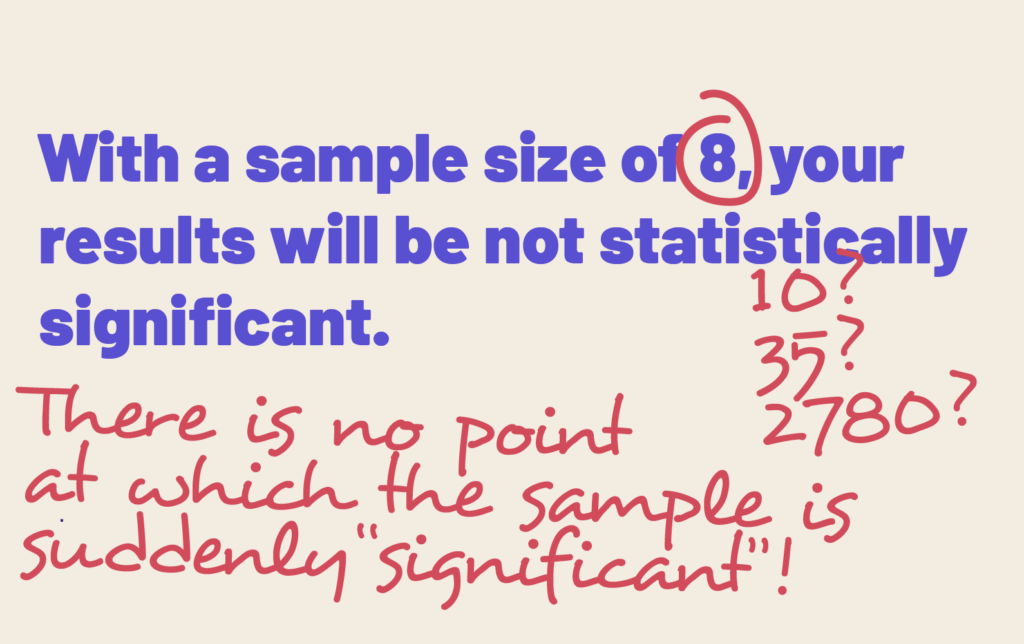
There is no point at which the sample size will suddenly become mathematically significant. There is no test for the significance of a sample size alone. I’ll say it another way: There’s no technical way to put a given sample size into either a “certain” or “uncertain” box. So that’s first problem with using the binary “not statistically significant” term around small sample sizes.
The bigger problem is that dismissing small sample sizes as “insignificant” has equity issues.
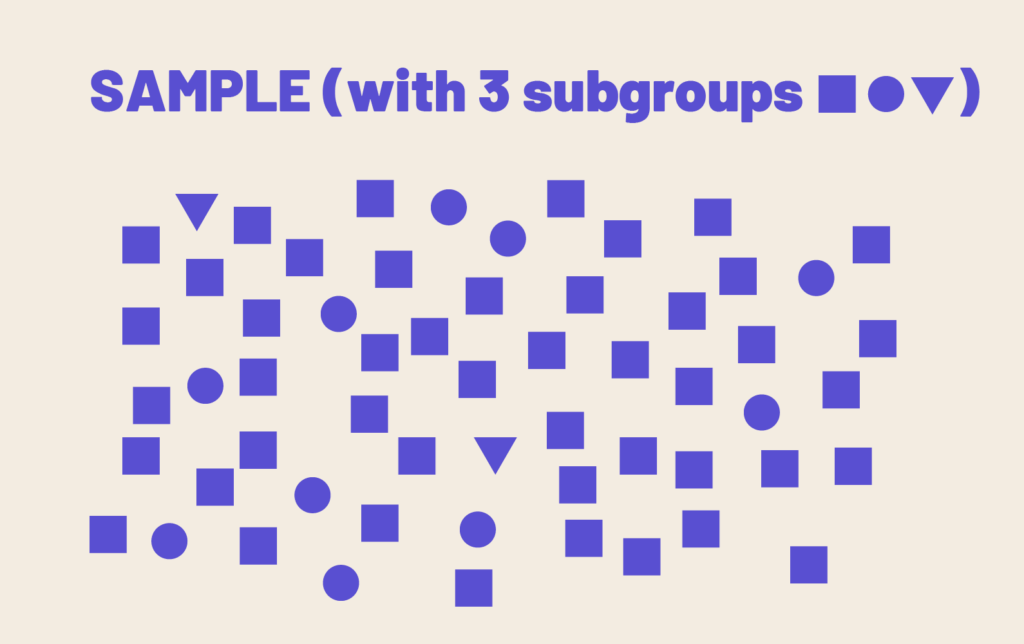
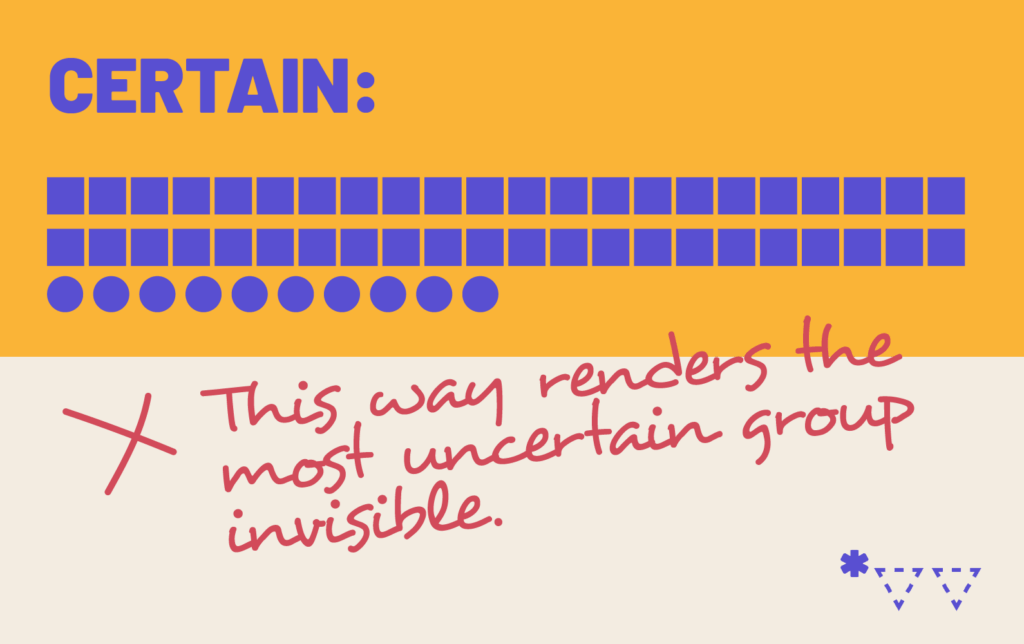
Let’s imagine that your town is made up of white, Black, Latinx, and Indigenous sub-populations. If you break out your results into these categories, and you have very few Indigenous respondents, you might be trained to say that their results are “not statistically significant”. But what you really mean is, “we have so few Indigenous respondents that we have a very high degree of uncertainty, and we don’t want you to even see the results in case you don’t understand just how uncertain we are about them!”
For people that are often placed into small sub-groups, like when data is broken down by racial/ethnic categories, being told over and over again that your data is being dismissed because it’s “not statistically significant” is very hurtful and unfair. Not only are you experiencing the insult of the common understanding of “insignificant” but your actual data is being discounted through no fault of your own.
And this isn’t just a feelings issue. I’m not saying use a different word, I’m saying those results are NOT INSIGNIFICANT.
First of all, though the absolute sample size may be small, the relative sample size may be high. For example if in a town of 15,000 people you have a sample size of 300 white respondents and only 18 Indigenous respondents, yes one sample is bigger than the other but if there are 13,400 white people in the town and only 48 Indigenous people, you have a much stronger relative sample size for the Indigenous responses. You’ve only captured 2% of the white population in your sample, but you’ve directly sampled nearly half of the Indigenous population, meaning you might actually be much more certain about their results than those of the larger demographic.
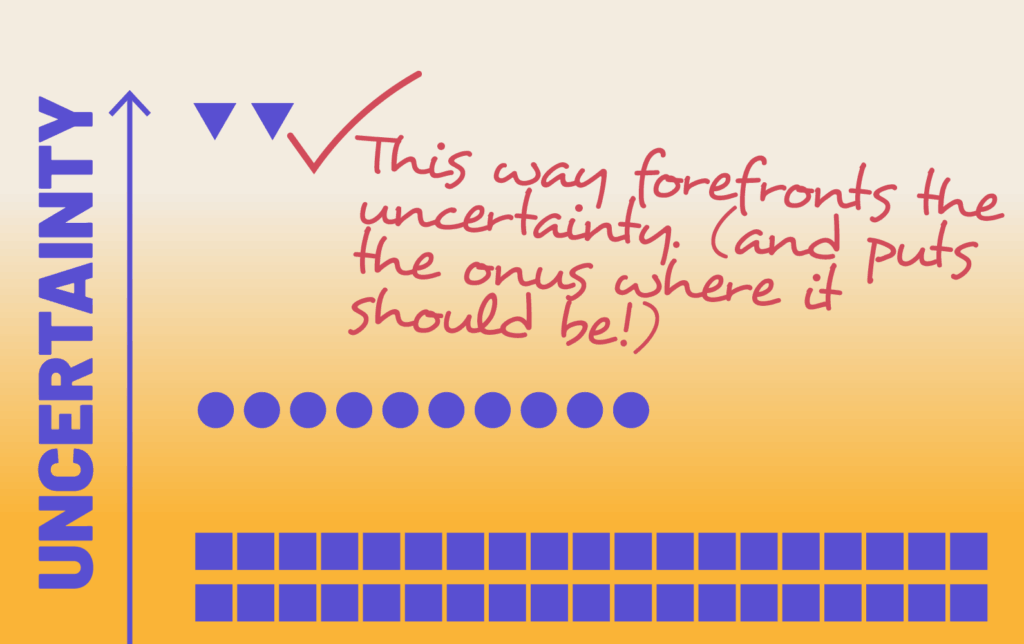
Secondly, even when you are in fact dealing with high levels of uncertainty around small absolute and relative sample sizes, that’s what you are dealing with: high uncertainty. The onus is on the people producing data to own the uncertainty in their results. If you report your results with confidence intervals and point estimates, and take the time to explain the various levels of certainty about each of those results, it puts the focus back where it should be. It leads to natural questions like:
Why are you so uncertain about the Indigenous category?
or
If you knew that your sampling was likely to produce such uncertainty for that group, why didn’t you try harder to increase their representation in your sample?
or
Why are you using a methodology or project design that only works for some of the subgroups you’re focusing on?
Saying “not statistically significant” because of an arbitrary rule of thumb with no mathematical basis oppresses the smallest groups within your sample, throws away useful data, doesn’t allow your audience to engage with the various levels of certainty in your work and pushes the responsibility of creating meaningful results off of you, the data producer, and onto minority sub-populations simply because they are smaller or more expensive for you to sample.
We need to learn to love uncertainty and get better at explaining it to our data consumers. The assumption that we need the term “not statistically significant” because our readers can’t possibly understand levels of uncertainty, because we need a shield to hide the uncertainty our project design has resulted in, or because we think that it’s easier to discount the data of entire groups than to explain the concept of a confidence interval is not only oppresive, but it holds everyone back from meaningful data literacy.
The next time you instinctively go to write off a small sample size as “not statistically significant”, remember that that’s incorrect and what you really mean is, based on what we have, we don’t really know…
P.S. We’ve got a whole other article with an example of how to talk about uncertainty in your reporting. Check it out here!