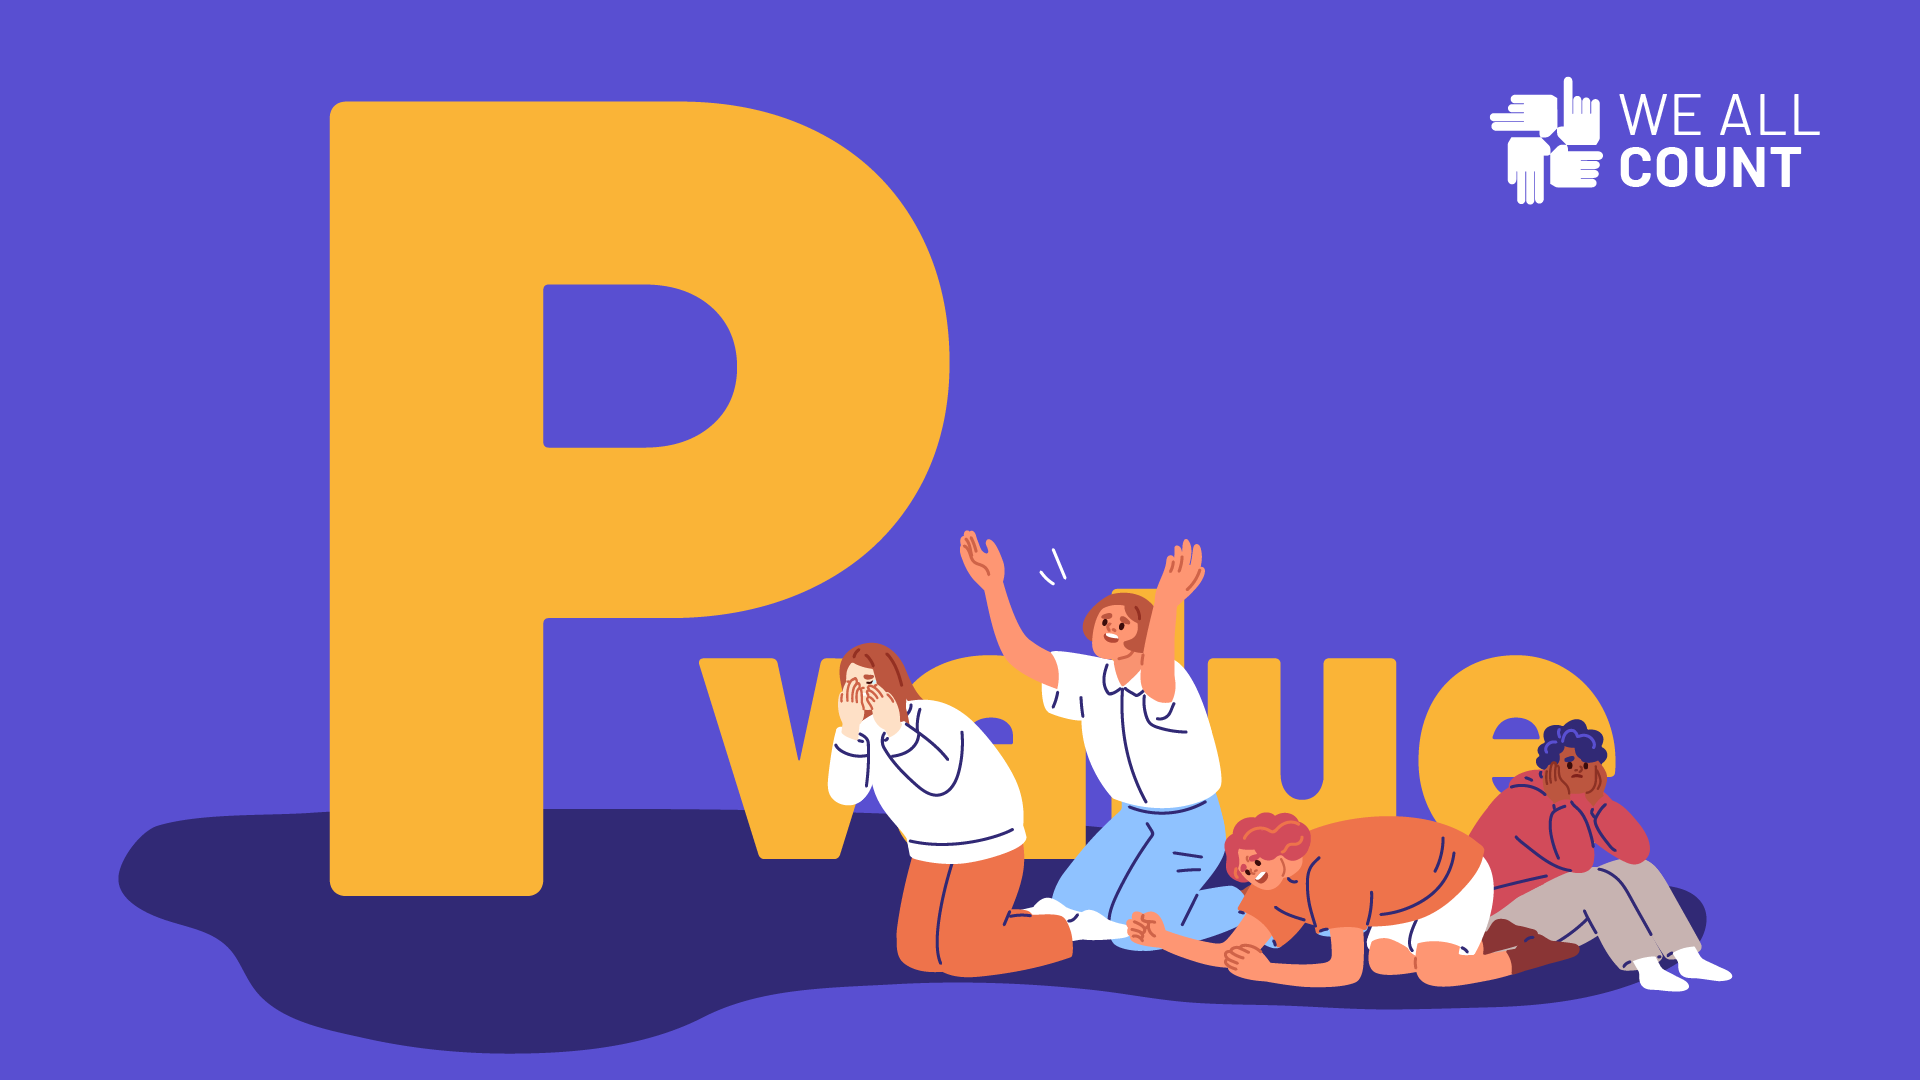
When we use data to predict something, there’s more than one way to improve the equity of that process. The one that we usually start with is setting a tolerance level for the gap between the group our predictive model works best for and the one it performs worst at. What do we mean by that?
The typical way that predictive models get improved is by measuring the prediction of each iteration of the model – each time we tweak and then run the model – against what actually happened. In the simplest binary (yes or no) cases, there are four general possibilities.
A: We predicted something would happen, and it did happen. This is called a true positive.
B: We predicted something would happen but it didn’t happen. This is called a false positive.
C: We predicted something would not happen, and it didn’t happen. This is called a true negative.
D: We predicted something would not happen, but it did happen. This is called a false negative.
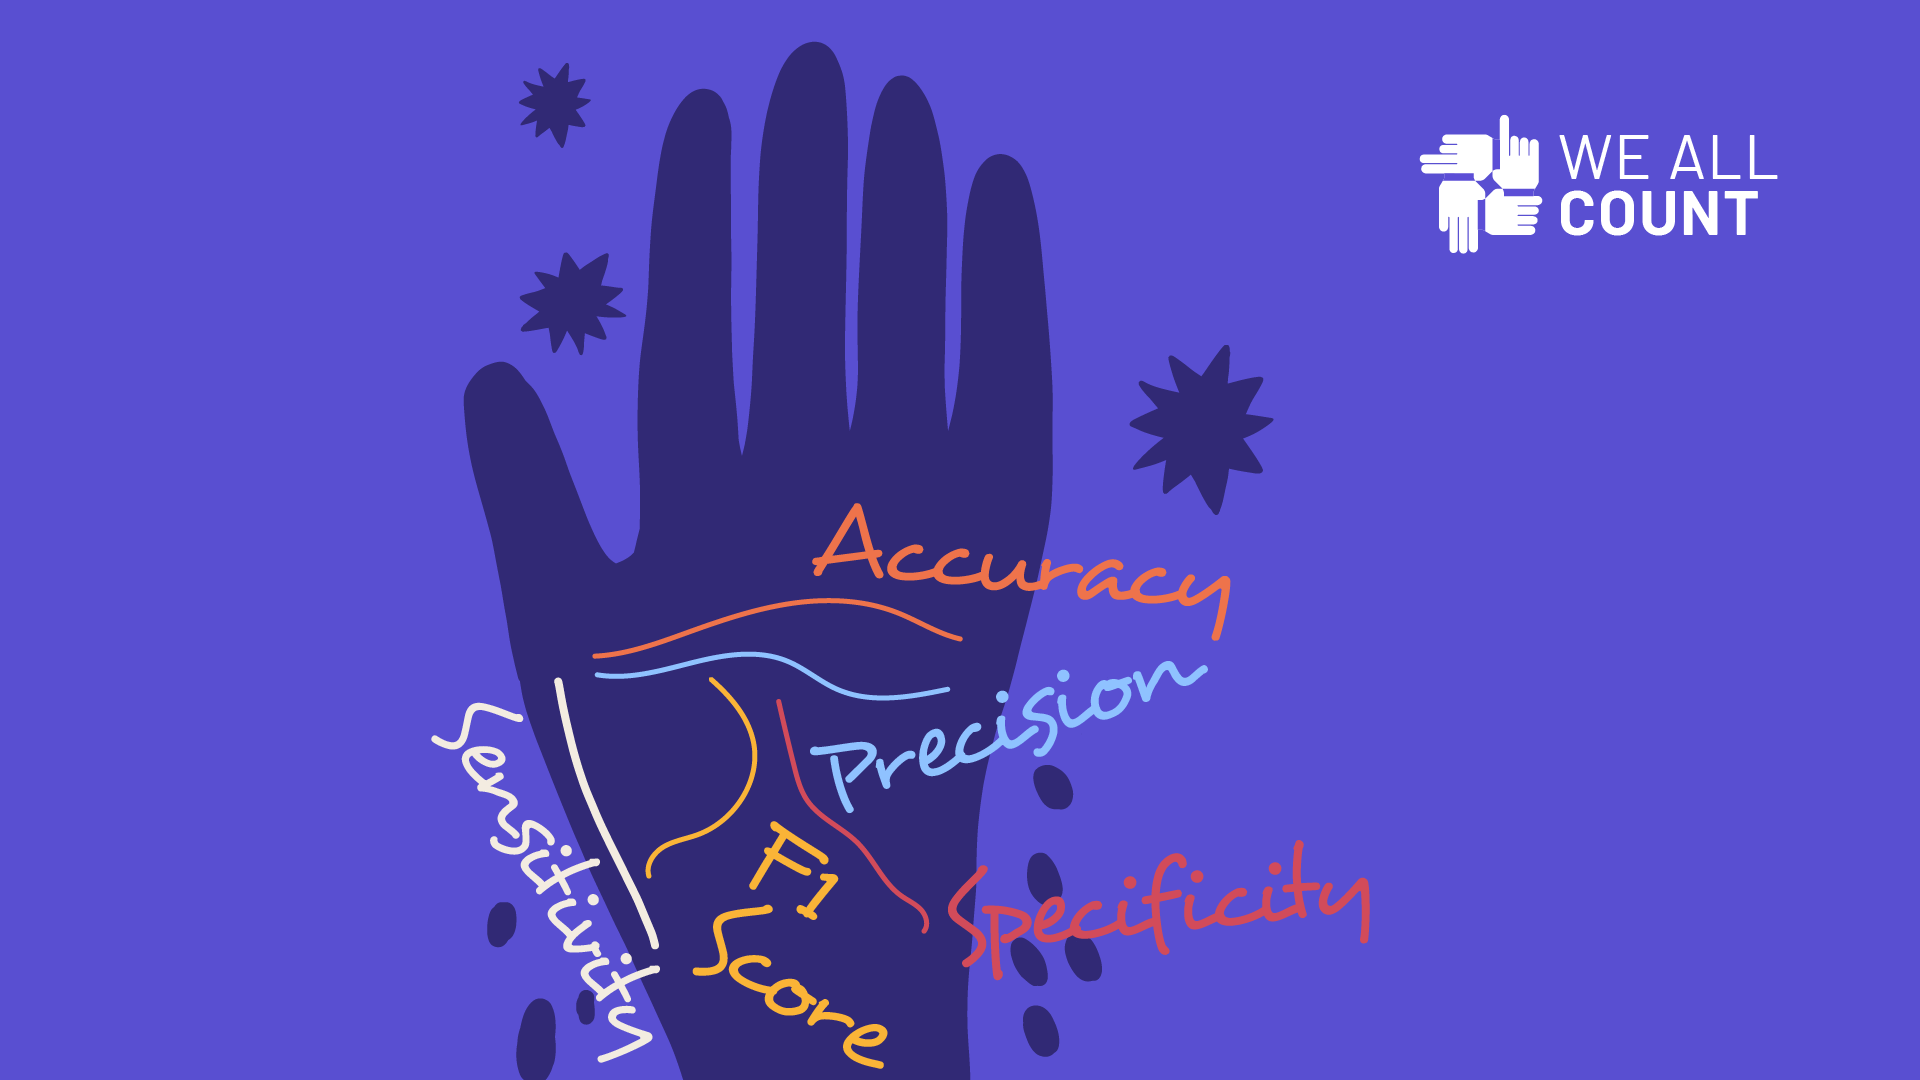
The way that we know how effective our predictive model is, is by comparing our predictions to what happened in reality. When we do this, we get several measures reflecting how well our predictive model performed:
Accuracy
Specificity
Precision
Sensitivity (aka Recall)
F1-score (aka F-Score / F-Measure)
So, a predictive model is judged by all of these measures. We don’t want to bog you down in what each one of these means in this particular article (Salma Ghoneim has a great write-up explaining the basics of each of these measures here if you are interested!). Yes, deciding which of these measures to prioritize will have big equity impacts, but we’ll save that for another day. Today, let’s talk about how we can improve the equity of our process when we get a table like this:
We don’t have to know exactly what each of these measures means, or even have a firm grasp on false positives and true negatives, etc.. We just need to know that a higher percentage (closer to 100) is better.
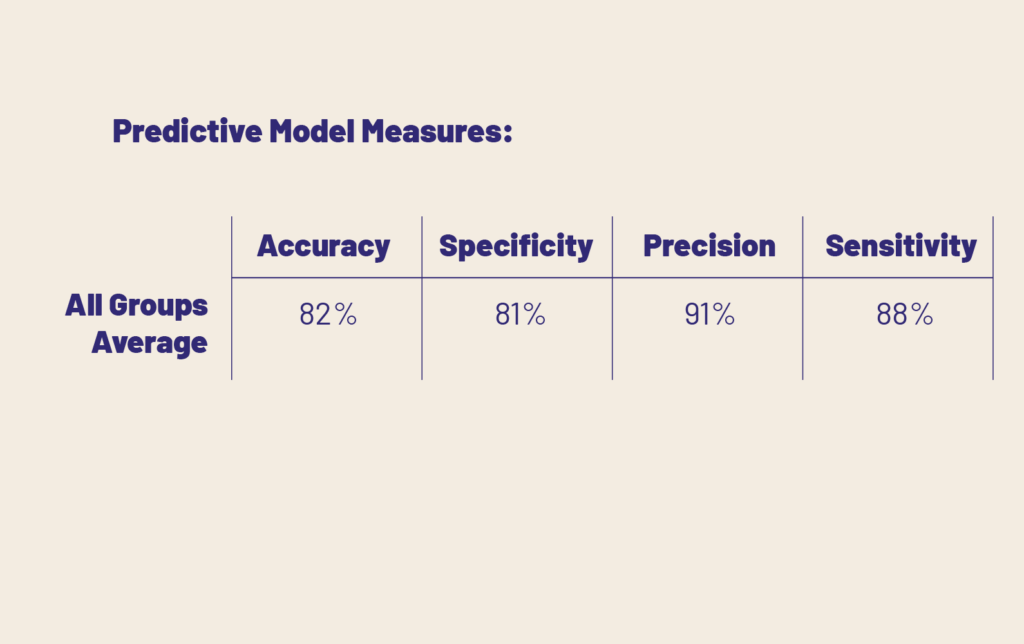
The easiest, most elementary way that we can embed whatever type of equity we are concerned with is to simply break out our predictive model effectiveness measures by group. Let’s say we wanted to check how well our predictions were working across race:
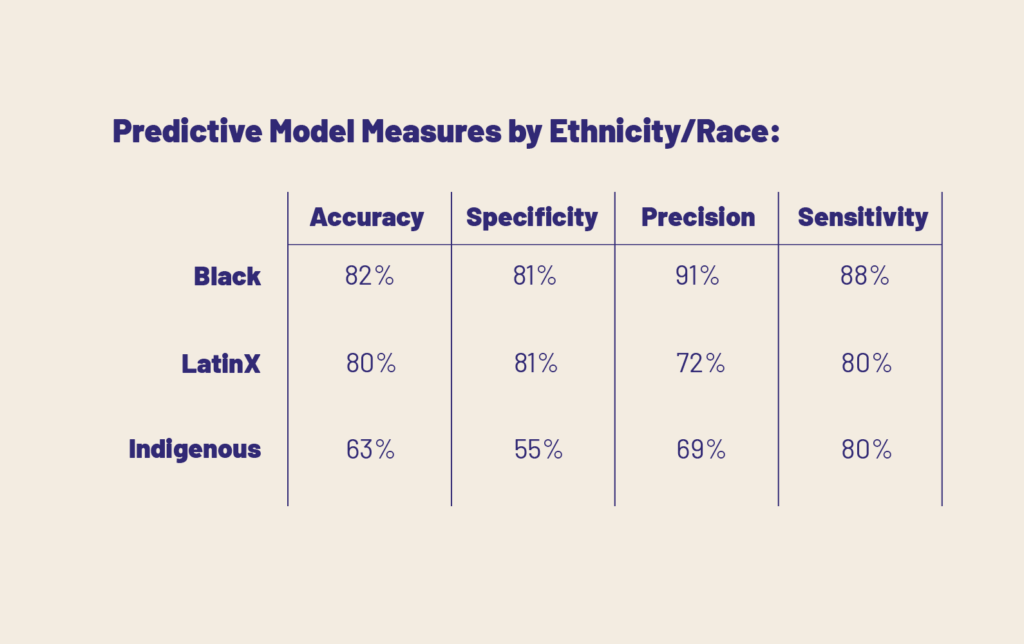
If we’ve decided which measure is most important to us, we can then identify which group our model works “best” for, and which group our model works “worst” for:
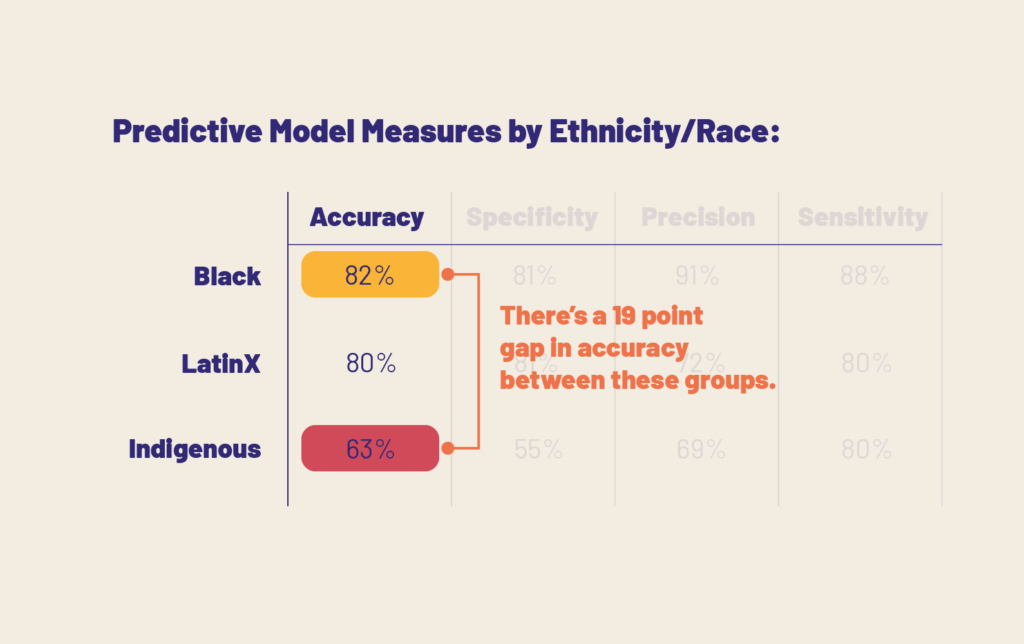
The key equity decision to be made is: what amount of difference between the groups can we tolerate before we feel that our model prioritizes one too heavily?
Sometimes you will have a lot of groups with relatively small gaps between them. Sometimes you will see that your model is greatly advantaging only a certain group.
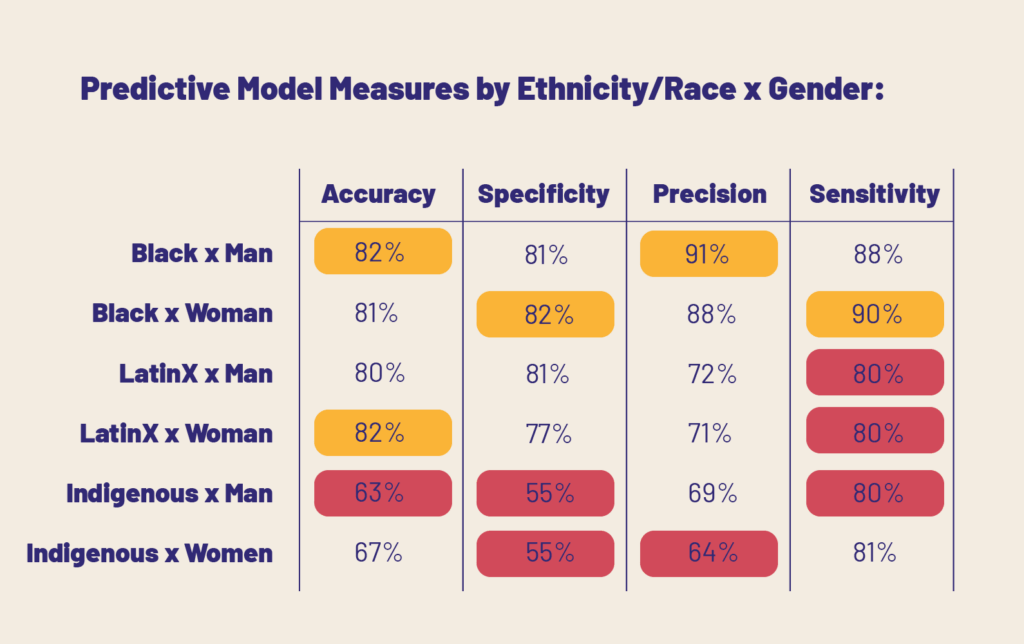
You can also do this intersectionally. If you’ve got more than one dimension of equity you are trying to address, say also gender, you can break out scores like this:
Now, unfortunately, we can’t just give you a universal benchmark like “a gap over 10% is too much”. Your tolerance level will depend on which measure or measures (accuracy, specificity, precision, etc) you are focussing on, the resolution and amount of data you are dealing with, and the overall structure and type of your model. However, it is essential that if you are trying to embed a certain level of equity between groups in your data, that you examine how the predictions are working for each of them.
Predictive models and algorithms are very tricky because we don’t always know exactly how and why they are arriving at their predictions. They typically don’t identify causes or mechanisms, just take all available data and gear it towards guessing what will happen. Companies, city councils, school boards, and planners of all kinds use predictive data to best prepare for the future behaviors, circumstances, and preferences of their stakeholders. That’s why it is doubly important to make sure that we don’t accidentally use a model that works well for only some of the people we are trying to help. The predictive power of data science is rapidly reshaping our world every day. Let’s make sure that it is working for everyone.