The first stage in the WAC Data Equity Framework is ‘Funding’. Understanding the interplay between money, data, and decision making is essential to measuring the equity balance in your data projects. We’ve found that it can feel very daunting to properly describe the relationship between these elements and to create a holistic overview of the power structure of your project.
At the beginning of every project we work on, we sit down with the project team and draw out a funding web. It’s a very simple exercise with powerful results.
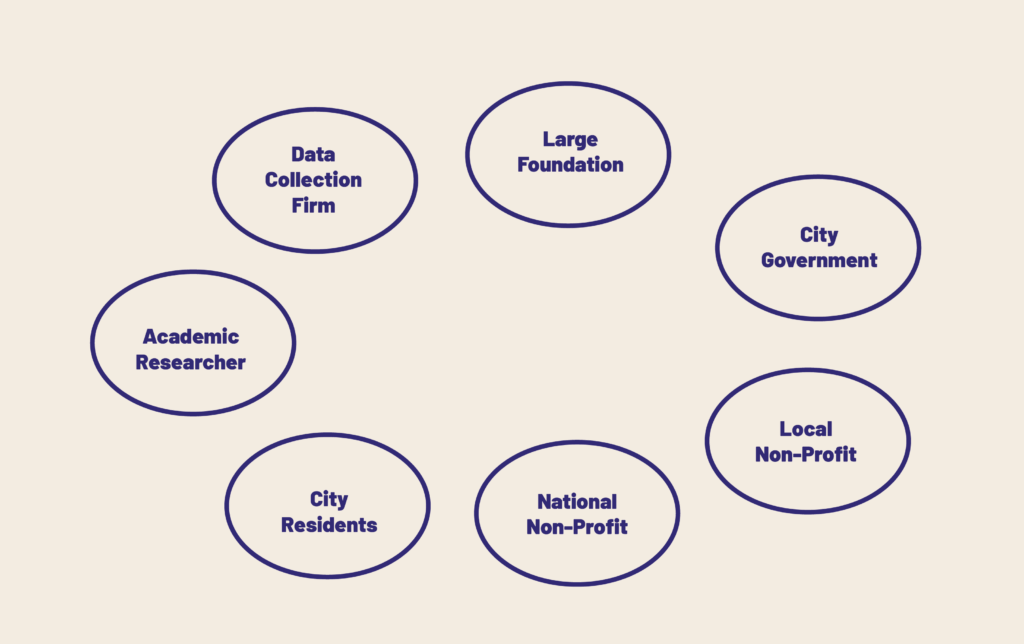
1. Draw out all of your stakeholders.
Stakeholders are any one involved in your data project. Stakeholders should be arranged in a circle around your drawing area, the order of stakeholders isn’t important. You can group them at the broadest level to start with, for example: ‘Large Foundation’ might have multiple departments or committees that you can break out in another more detailed funding web or ‘City Residents’ might be a sample population with a variety of important subcategories that you can break out later. For now, just put every stakeholder you can think of on paper.
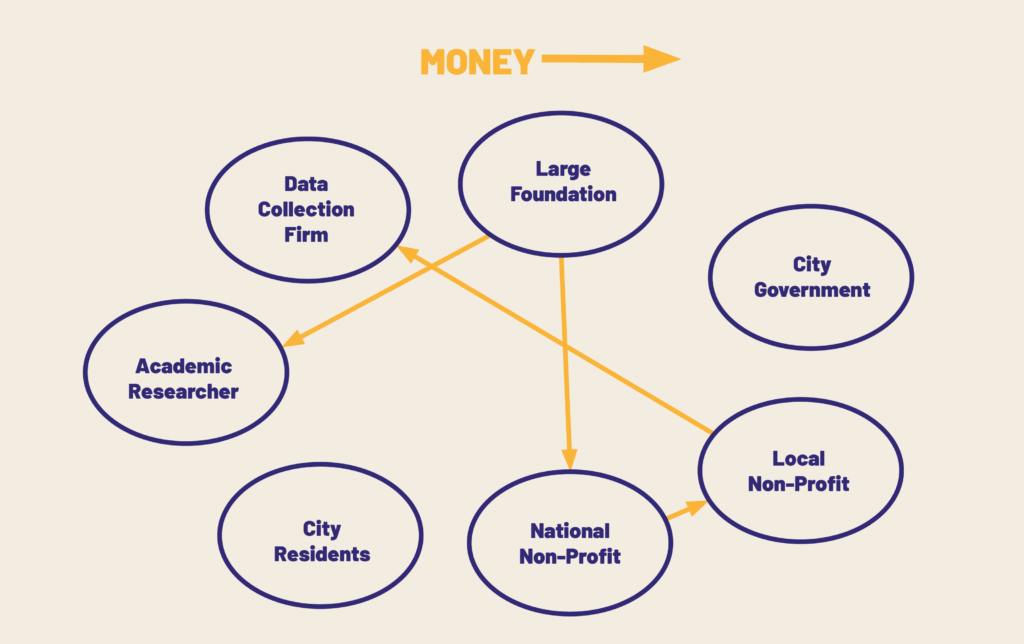
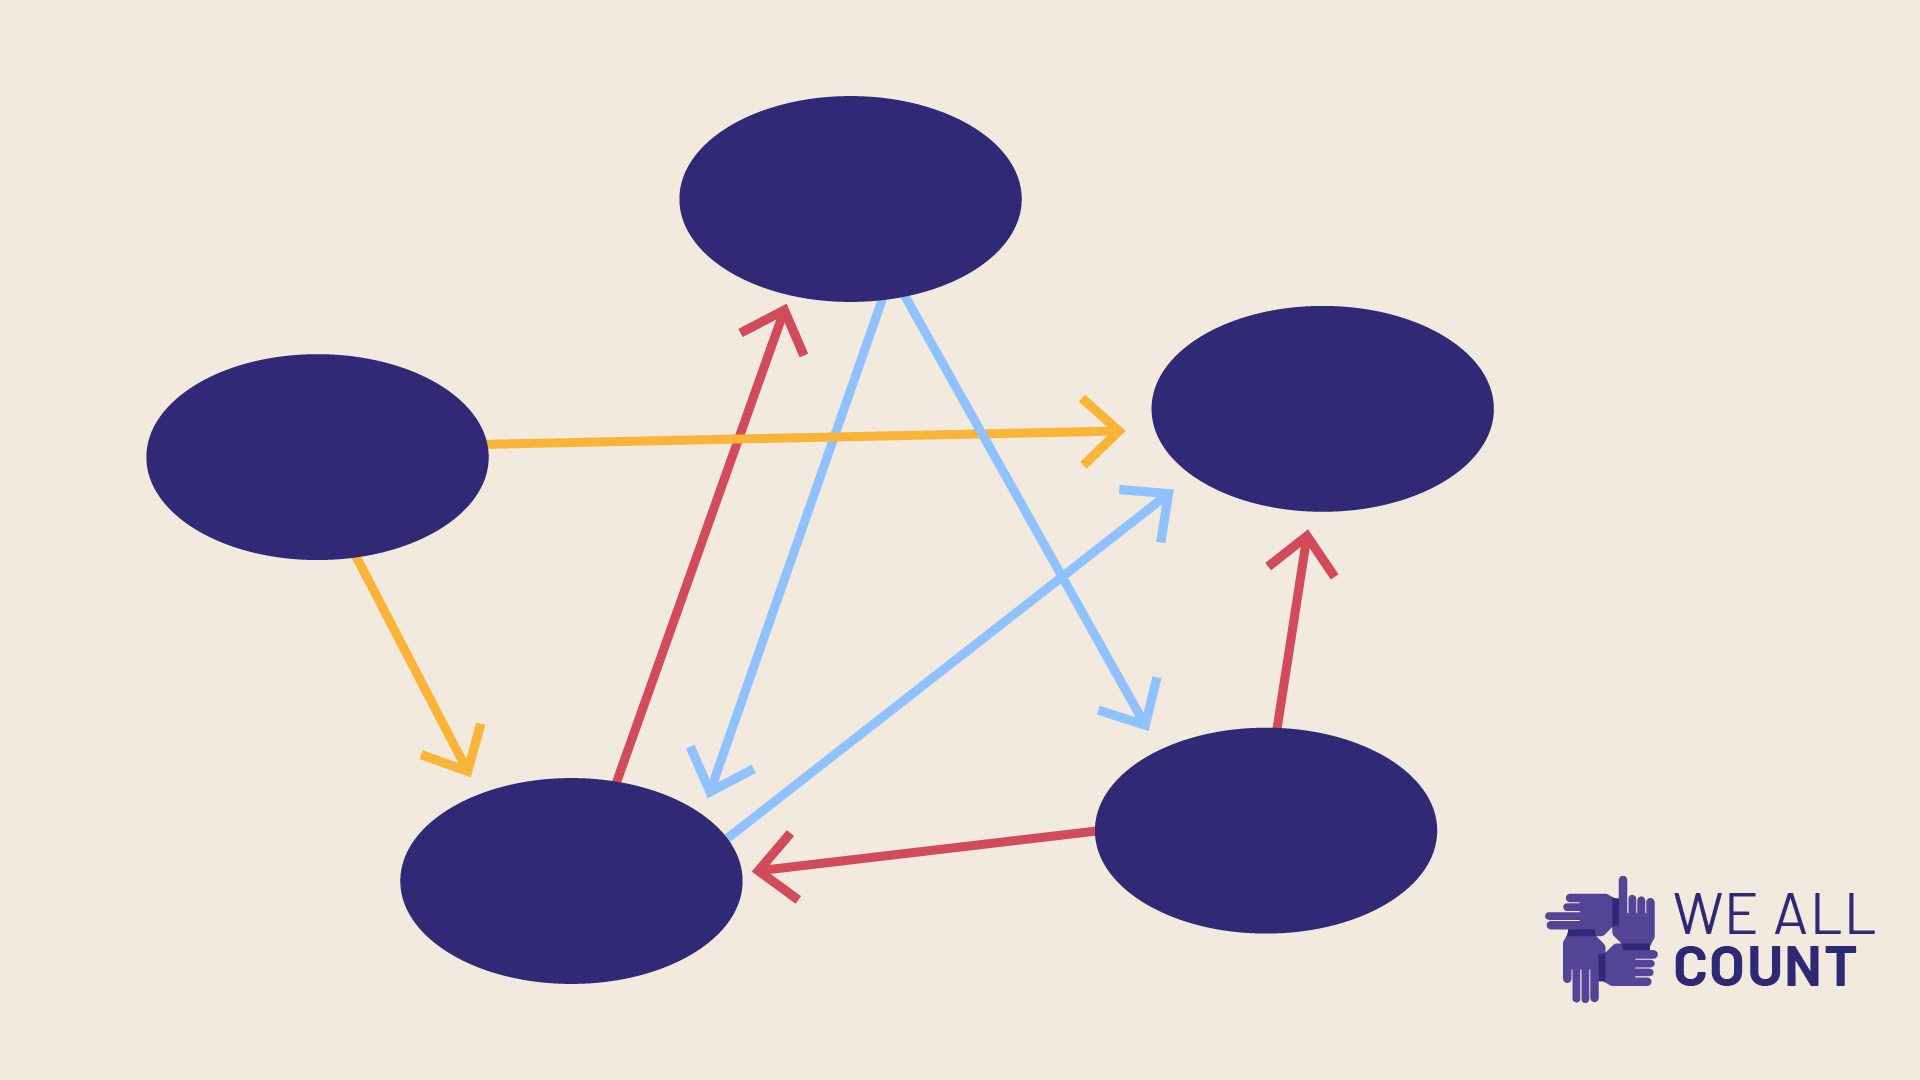
2. Draw directional arrows (in this example YELLOW) to represent the flow of money.
In our example, the Large Foundation is providing a grant to the National Non-Profit who is selecting a Local Non-Profit to conduct the data project. The Local Non-Profit will be hiring a Data Collection Firm.
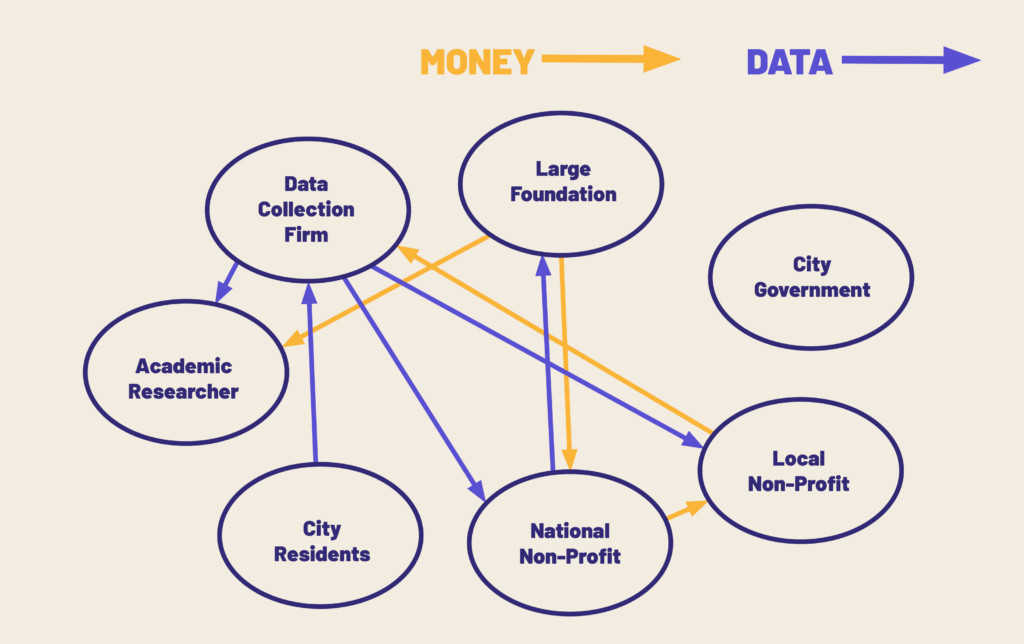
3. Draw directional arrows (in this example BLUE) to represent the flow of data.
The data source in this project is the City Residents. Their data is collected by the Data Collection Firm and then shared to various sources.

4. Draw directional arrows (in this example RED) to represent influence.
In the Funding Web, influence means who can make decisions about the data project that other stakeholders must follow. Note that this is influence over this data project, not in general. In this example, the Large Foundation has influence over several stakeholders in the reporting structure, result publication, etc as a term of its funding.
That’s it. Drawing out your stakeholders and the relationships between them in three key aspects – money, data, and influence – is all you need to do to make a very useful funding web. It’s a useful tool in a few ways.
First, without any adjustment, it provides clarity to all the members of the project and transparency to your audience when attached to your reporting.
Second, its most valuable function is to show power gaps and imbalances. Who has very few arrows coming to them? Who has many? How could this project be adjusted to correct these equity issues? Do you need to increase some stakeholders’ access to data? Do you need to collect data from other stakeholders? Do you need to pay people you’re not paying? Do you need to give meaningful input to someone who doesn’t have any or reduce the influence of a stakeholder that has too much?
Third, the Funding Web is a systematic way to brainstorm more creative and effective project structures, without even having to mention methodologies, project designs, or scope and scale. Taking the time to write out all possible stakeholders of your project and really play around with what they can contribute and receive from the project opens up unconventional possibilities that can make your project more equitable, and just plain better.