
Step three of our Data Equity Framework is Project Design. This is where your big “why” turns into a concrete “how.” In quantitative projects, we need to translate general questions into hard numbers. For example, if our interest can be expressed like “how is the economy doing?”, a quantitative approach might supply a trend in gross domestic product (GDP) as the answer.
“How is the economy doing?” -> GDP growth for this year is +4.8%.
Simple enough, right? Well, when it comes to quantitative data equity, there are three really important choices here that can be hard to see unless you slow down and examine this process deliberately.
- What specific questions are generated from our general question?
- Where should we look for data that reflects our question?
- Who gets to generate specific questions, and who gets to identify data sources?
Because someone, let’s call him Dave, who jumps right to GDP as an answer to “How is the economy doing?” really went through this process:
“How is the economy doing?” -> hmmmm, I think a key question about that is: “Is the total value of goods and services produced within this country’s borders increasing?” -> I’m going to collect a ton of consumer data, investment data, government spending data, and trade data. -> I’m going to calculate GDP -> I’m going to point to that as my answer.
That’s a lot of work (especially if it’s just Dave calculating GDP, not a national agency like in the real world!), but it’s also a lot of subjective and power-laden decision-making. If someone named Susan encounters the same question, she may be more interested in poverty and point to data like food bank use rates to explore the same question.
“How is the economy doing?” -> “I’m struggling to meet my food costs for my family, obviously how many other people are in the same boat is a great indicator of economic health” -> I’m going to collect a bunch of service use trends across food banks -> I’m going to point to that as my answer.
At We All Count, we use a visual metaphor we call the Microscope Tool to notice, explore, and even participatorily facilitate these key choices. At this point in a data project, we can think of our next step as relying on three interchangeable microscope elements, different configurations of which will point us to different questions and different data.
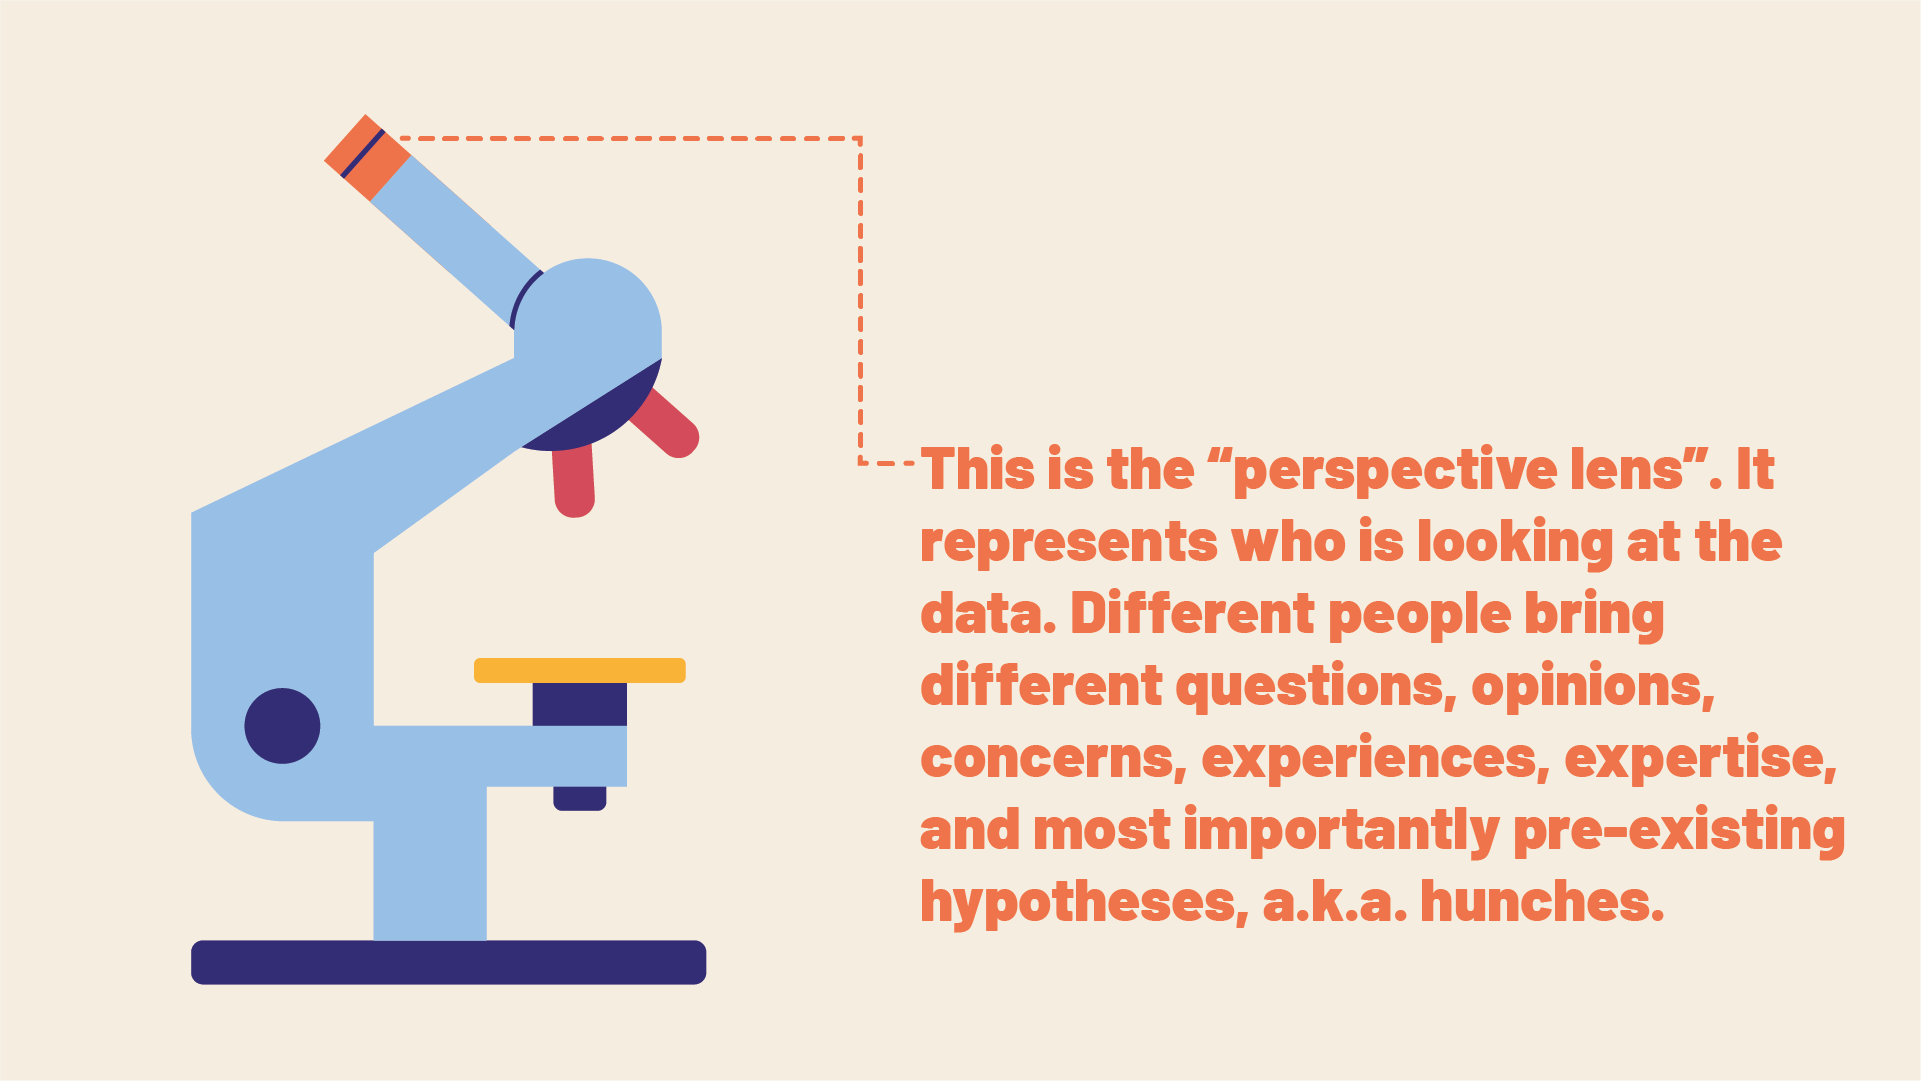
The top element is the “perspective lens”. This is all about considering how who is investigating something affects what they want to look at and what questions they have. Our experiences, training, knowledge, feelings, and assumptions affect what questions we think to ask and where we think we might find answers. That can be as dramatic as the difference between someone who wants to investigate criminal violence by examining drug use data and someone who wants to look at police brutality rates. They can also be as nuanced as one education researcher who wants to dig into literacy rates by school versus another who would rather look at literacy rates by student.
No data project inherently suggests universal, objective questions nor universal, objective data sources. If it feels like there’s only one way to approach your data project, you either lack imagination or are too enthralled by a previous (possibly brilliant!) approach. Our best scientific breakthroughs across all disciplines can be most frequently attributed to the “geniuses” who were able to ask different questions or look in new places.
Secondly, there’s a major equity issue here. The perspectives that get used to form the structure of a data project are heavily privileged in that project. There’s no problem with that, and it is also unavoidable. You can’t start to investigate, say, homelessness, without a list of things you think are or are not relevant to homelessness. Even if that list is someone else’s it’s still subjective. If we only pursue data projects that answer questions like “how is the economy doing” from one perspective, that perspective is hugely privileged. And the breadth, resilience, and fairness of our discipline’s output will suffer.
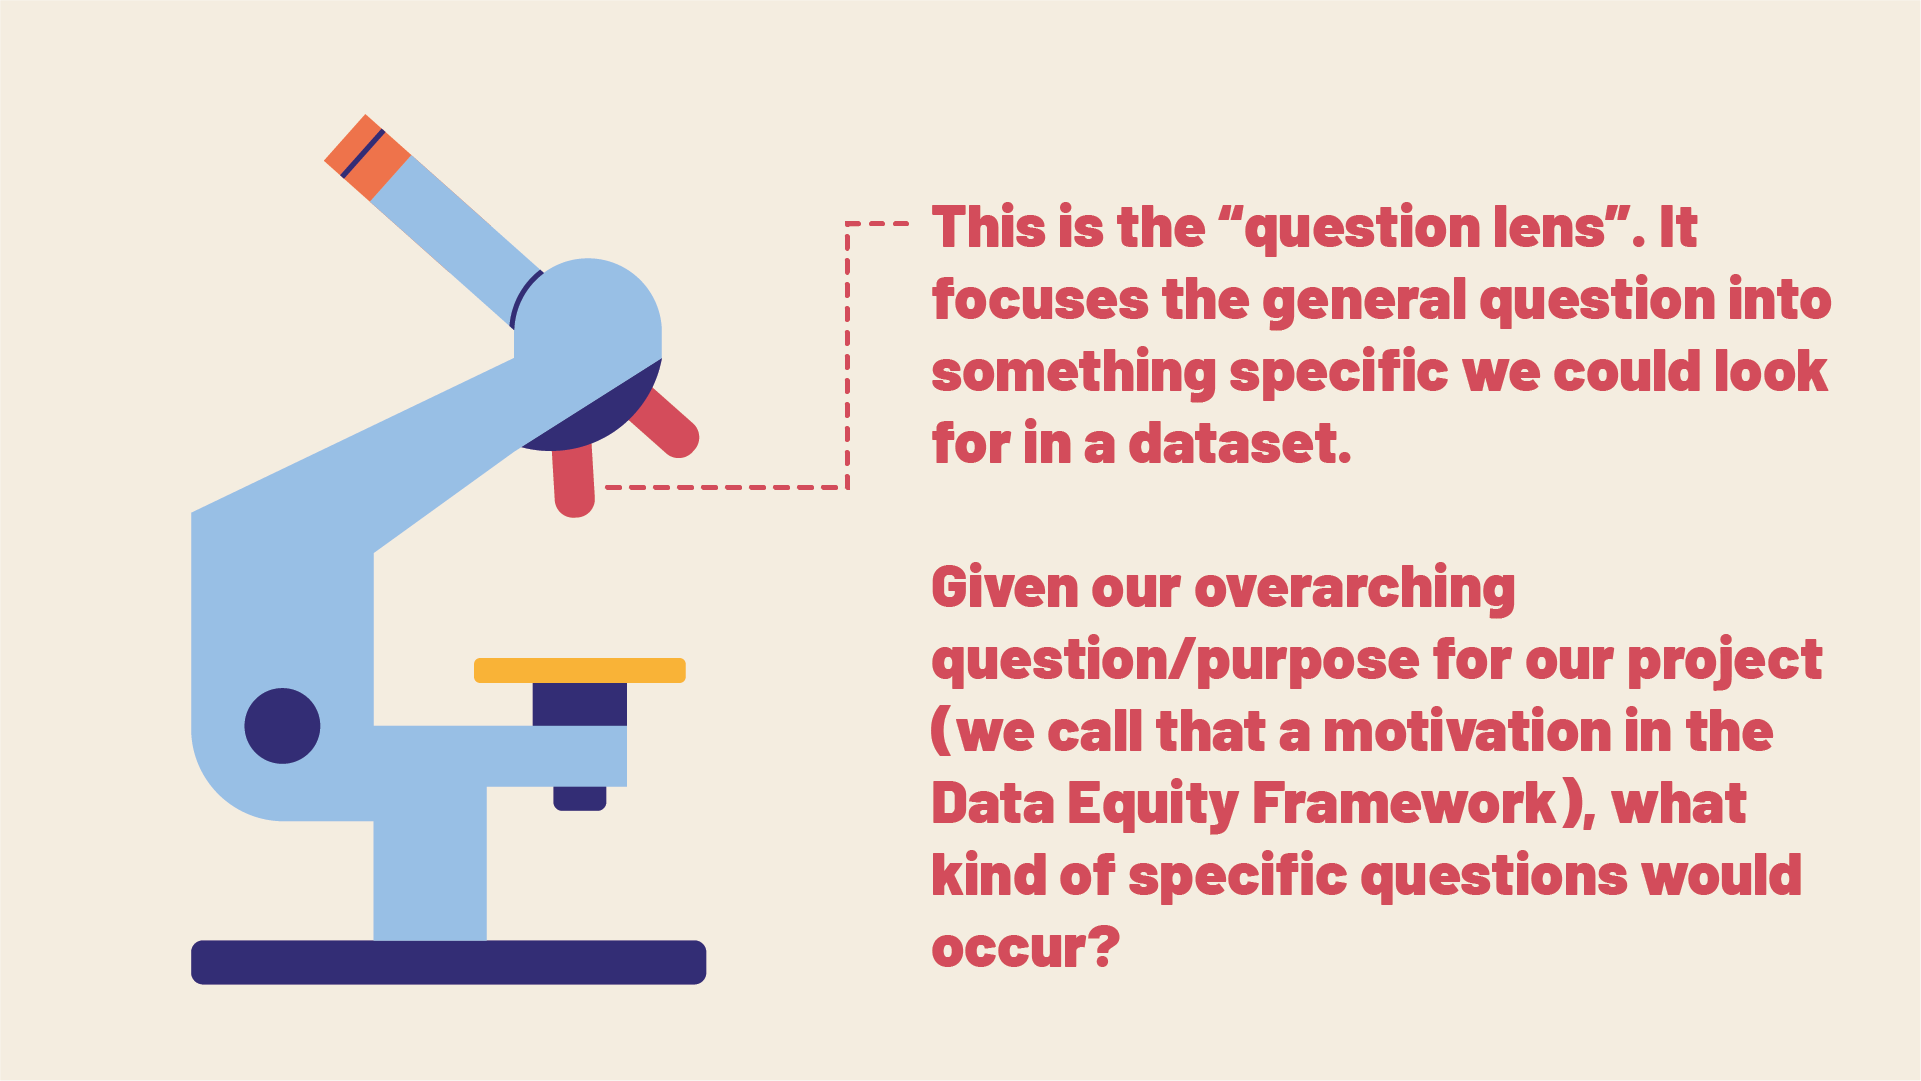
If we want to leverage the tremendous power of quantitative statistical science to help us describe, understand, and improve whatever we care about, we will need to eventually find some numbers that we think are relevant to our key question. To do this, we need to come up with some specific questions that can be answered with a number. In some sectors, a set of highly constructed queries that point towards a particular data set or the result of a certain analysis is sometimes called a research question. When it comes to the Microscope Tool, we recommend operating one level of generality above that. You can get really (really) careful about how you refine your question in a further step. Instead, at this phase, the goal is to use your perspective on your project’s general focus to brainstorm more specific questions. Think of it as a focusing moment.
“Why are graduation rates in this district lower than the national average?” -> “How effective are the teachers?”
“Why are graduation rates in this district lower than the national average?” -> “How hard are the students working?”
“Why are graduation rates in this district lower than the national average?” -> “What are the school environments like?”
“Why are graduation rates in this district lower than the national average?” -> “How have graduation requirements changed over time?”
Now, of course, there can be multiple rounds of focusing, getting closer and closer to a single question, and more and more related to a single number:
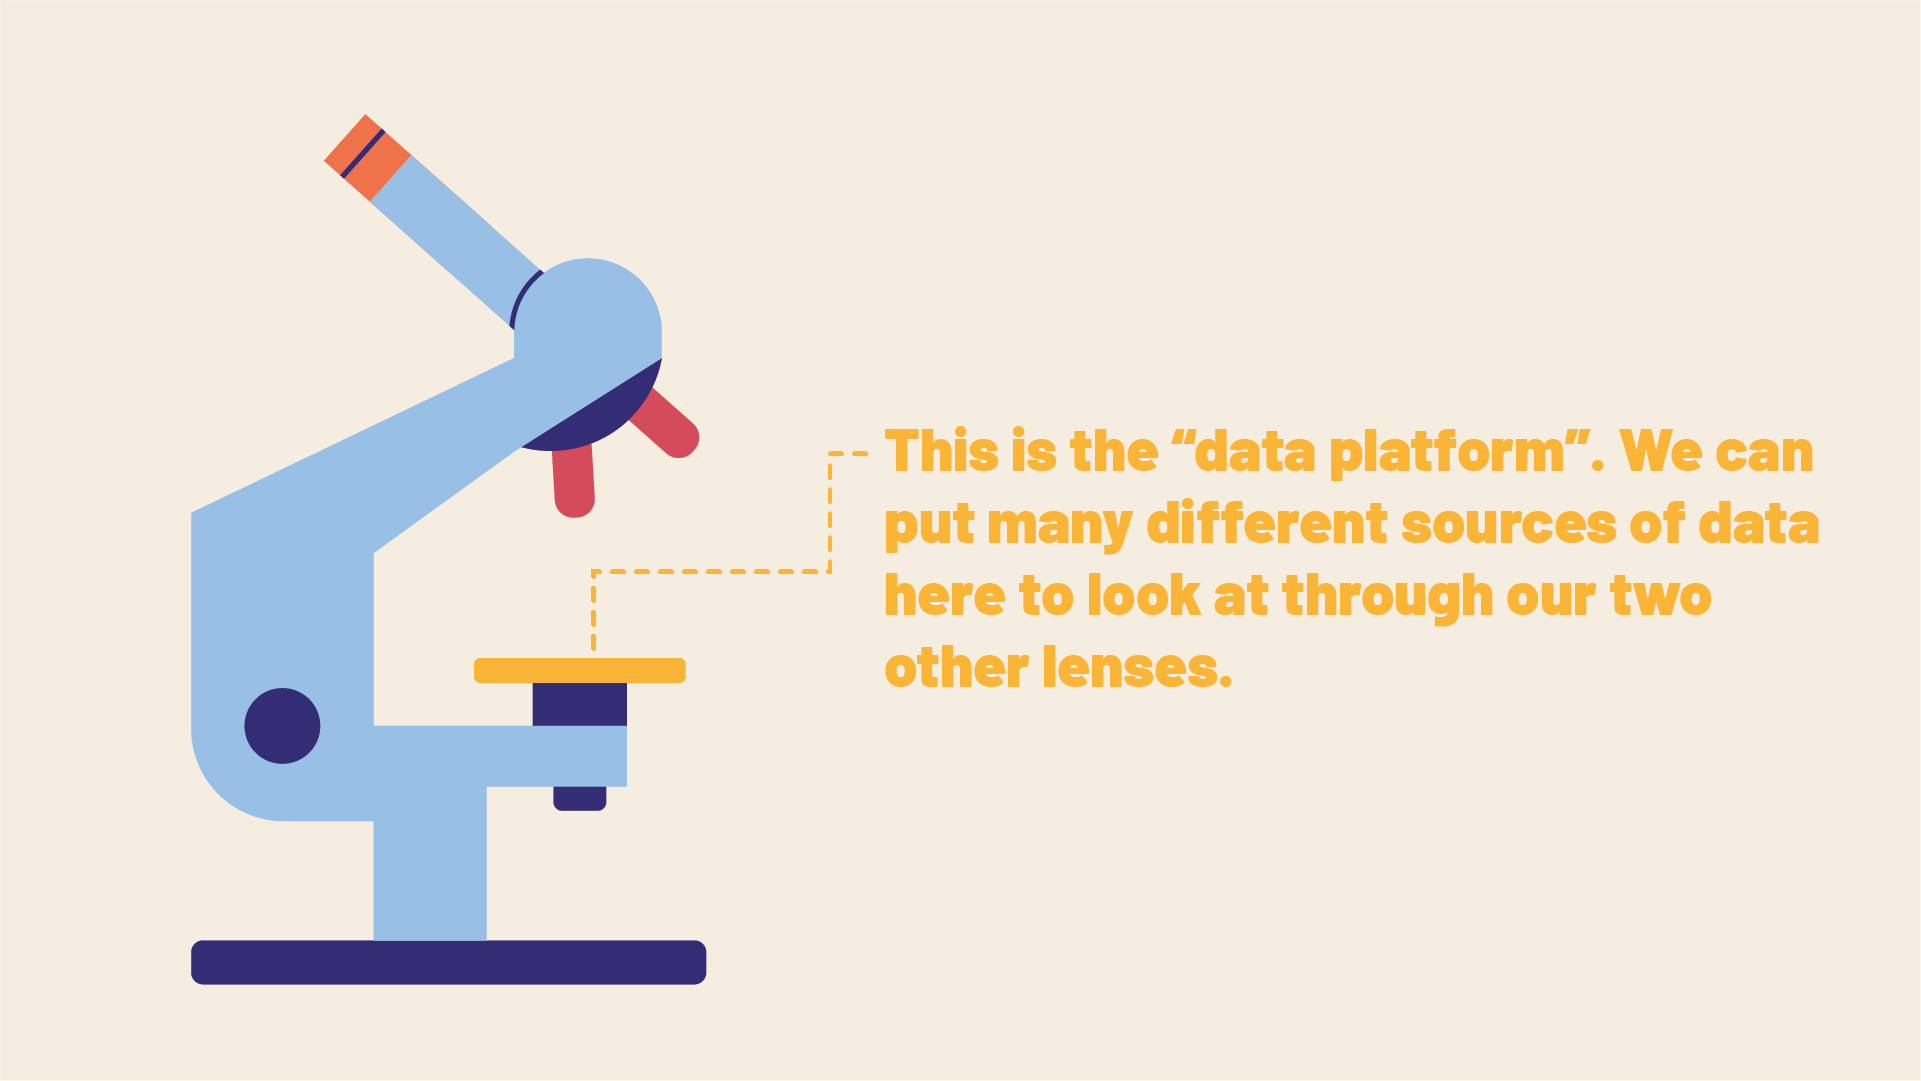
“Why are graduation rates in this district lower than the national average?” -> “What are the school environments like?” -> “How many students feel unwelcome in the school environment?” -> “how many students are reporting explicit instances of racism in the school environment” -> “what proportion of student respondents from last year’s survey reported instances of racism in the school environment?” -> etc. Now, remember how we avoided the trap of assuming that a general question inherently suggested a whole project structure. Well, no specific question inherently suggests a data source. Where we think to look for data is also a subjective choice that is informed by our worldview, area of expertise, and assumptions. Nothing wrong with that, but we’re gonna’ want a way to examine it carefully and definitely a place to write it down.

Let’s look at an example of how we used the Microscope Tool to explore various perspectives, questions, and data sources in a project surrounding the resettlement of a large number of Syrian refugees in a major Canadian city. The project had a variety of stakeholders: the refugees, the previously established Syrian newcomer community, the municipal government, the federal government, researchers from a local university, and a non-profit organization. We led them through a series of sessions that all started with the general question: “How well is our refugee resettlement program working?”. Here are some examples that came out of the sessions, as well as some annotations from me:

Hardly revolutionary, but that’s fine. It’s important to consider as many things as you can. This reflects the non-profit organization’s priorities in that it is really an evaluation of their work, and because it places some mild data burden on someone else.

A very, very common exploration from the perspective of a funder. Demonstrates interest in efficiency and has a resource allocation/impact framing. It’s important to note that they could also have picked other data sources to pursue the same question, as is almost always the case.

This is a form of self-study that was one of the first suggestions of this group of stakeholders. It is interesting because job integration is not a key metric we had previously prioritized in a more socially oriented program. It can highlight deltas between our and other stakeholders’ priorities.

This is a great example of how, without changing the perspective or the question lenses, there are many options to explore. This permutation came about in facilitation sessions with both refugee community members who provided the question and data analysts who offered their expertise in knowing that this dataset existed and could be helpful in this project.

This is an example where we locked the data source. We came to the university researchers asking them to help us utilize a great data source for which no other stakeholders had generated questions. By narrowing the parameters from where we started: “you can look anywhere” to this one data source the members representing this perspective were able to come up with a great question that not only enriched the project but surprised even them.