
How much water per bouquet? If we watered them all using the average required per bouquet, we’d over water one and underwater one. What’s the problem: we’re using the denominator of bouquets instead of flowers.
Defining your denominator is as important as defining your numerator.
When we’re working with descriptive data questions – trying to use statistics to get a picture of what’s happening – we’re often trying to describe the ‘typical’ or ‘average’ rate of something. Rates have denominators, or units of analysis, or what I call the “after per”. Low-birthweight babies per capita. Libraries per neighborhood. Meals per week.
We spend so much time in data science talking about and defining the numerator -the first part – of these rates. What do we consider low birthweight? Are stillbirths and miscarriages being included? Is low birthweight based on a benchmark for full-term births? These are common and important conversations happening across all kinds of data projects.
If I just eat crackers accompanied by spoonfuls of jam before flopping down into bed, does that count as a “meal”? According to me, yes. My spouse and I debate this numerator frequently.
When it comes to the denominator, however, data scientists often select and define it thoughtlessly or even automatically. That’s because denominators are usually defined by our unchallenged assumption of the norm. Who gets to be part of per capita? What defines a neighborhood and why is that our unit of measurement? I talk a lot about how to define denominators elsewhere, but today I want to look into that second question: why is that our unit of measurement?
Who is privileged by our choice of unit?
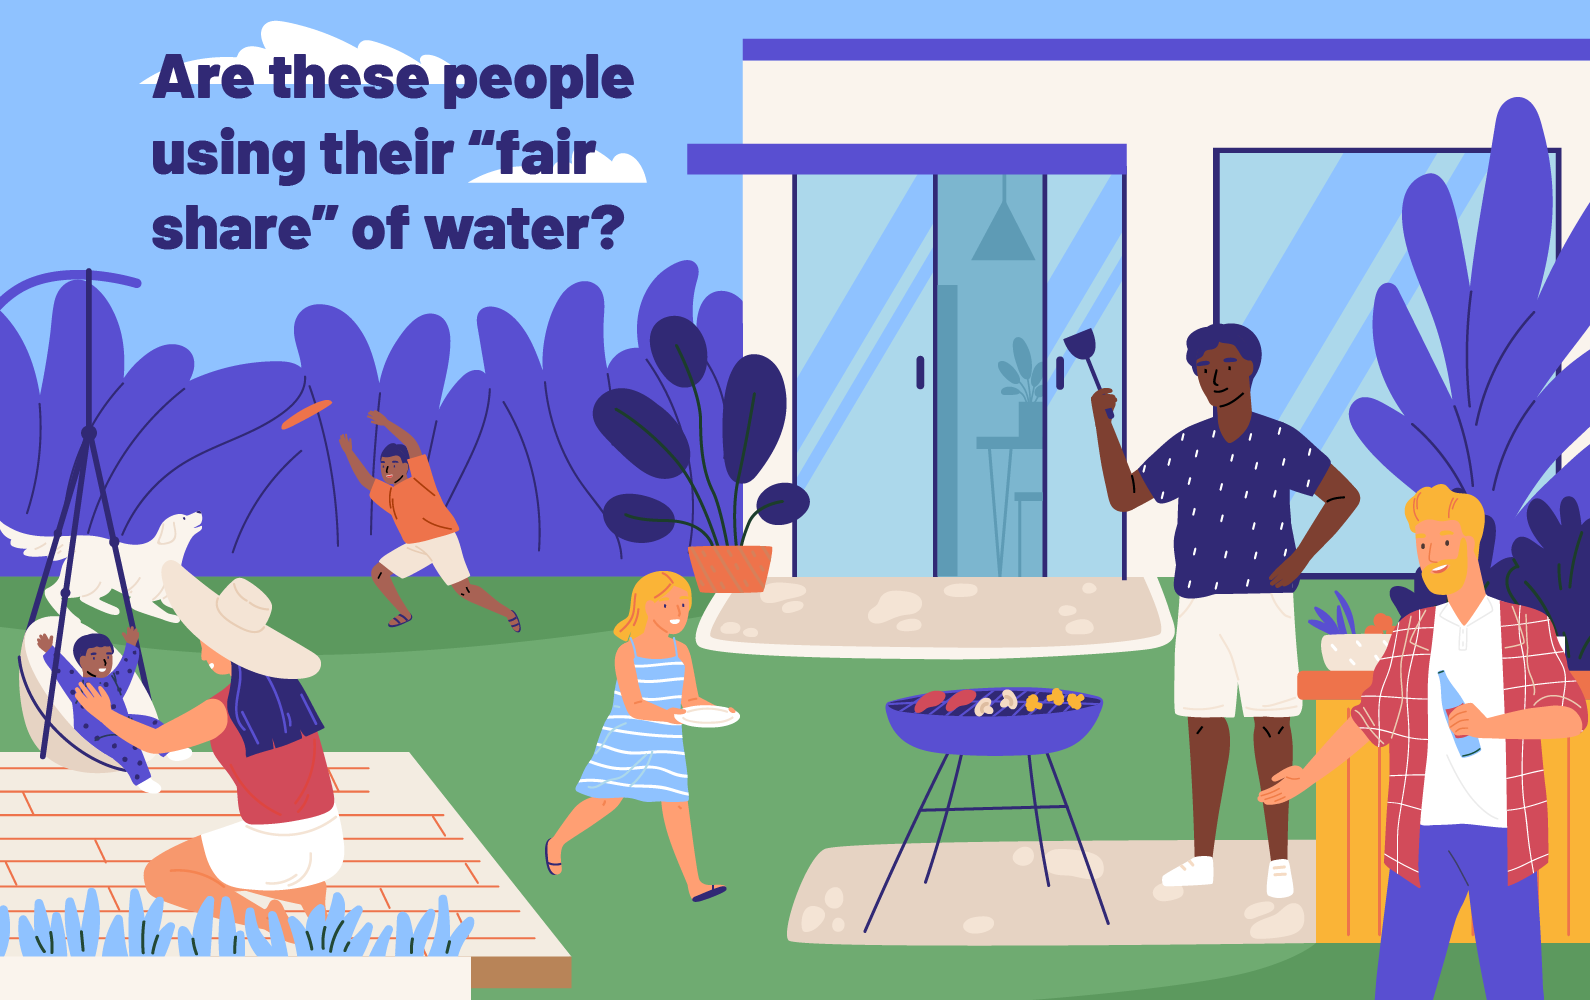
Using a certain denominator accepts a norm; accepts a default; accepts a perspective. Some denominators will privilege certain people more than others. Let’s look at an example around water usage rates:
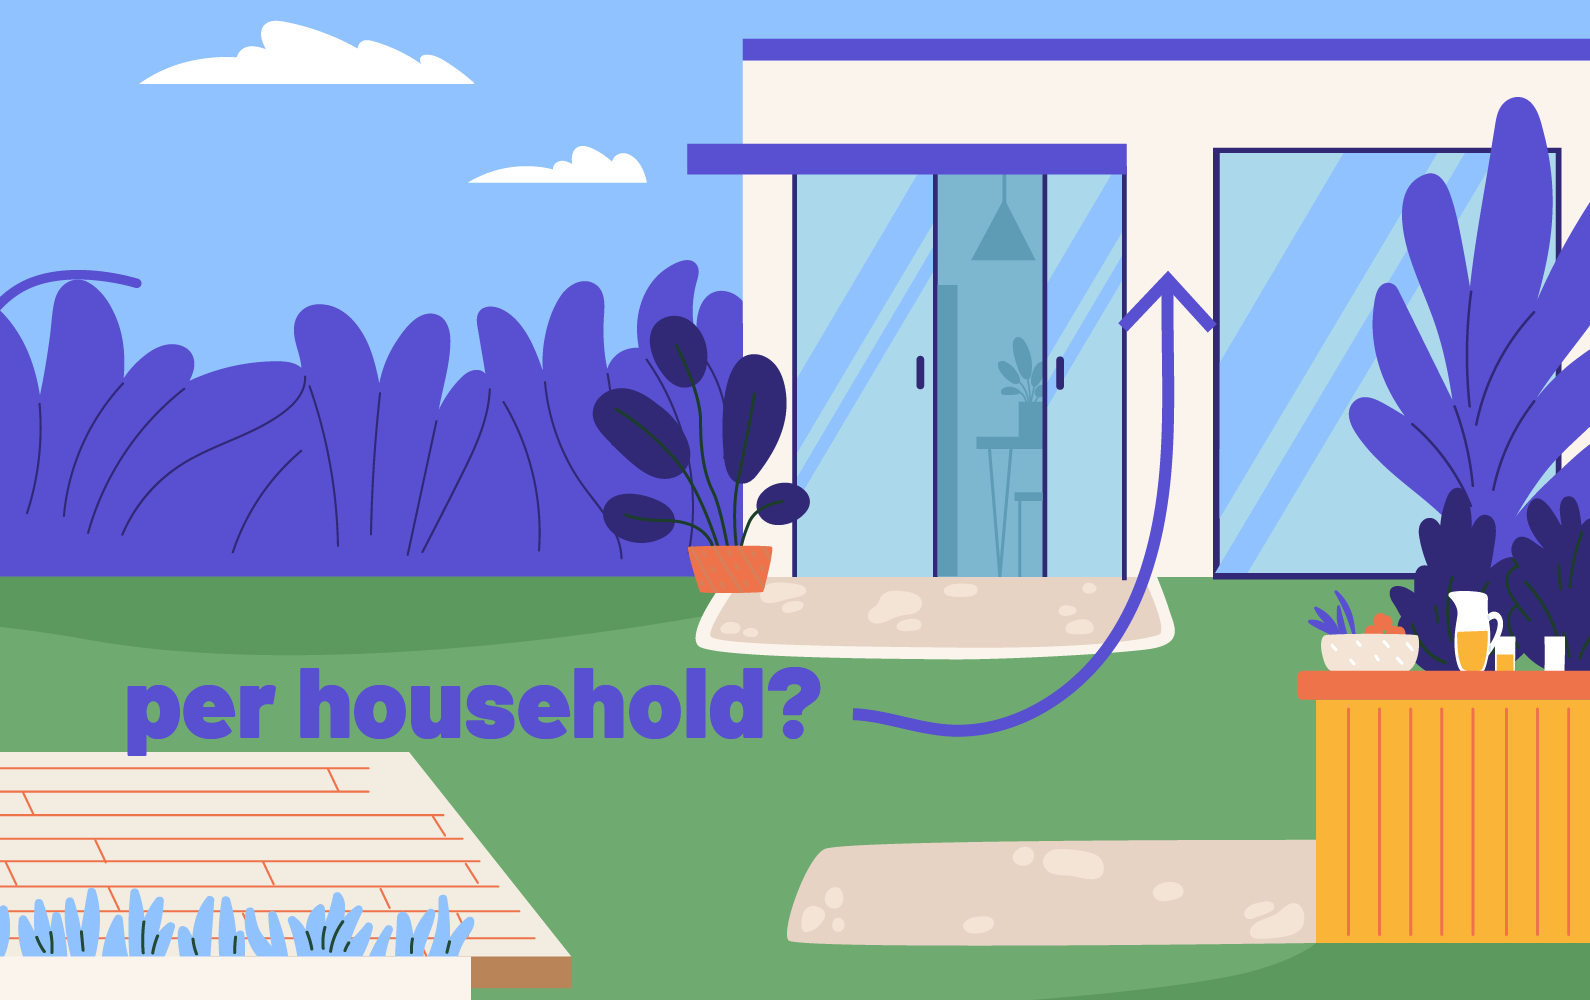
Let’s say that we want to limit water usage in a municipality going through a drought. We’ve noticed a big difference in the average water consumption rate from one neighbourhood to another. The richer, whiter neighbourhood has lush lawns that are clearly getting watered, yet their average gallons of water used per house is still slightly lower than that in the poorer part of town where houses often don’t even have lawns or gardens! If we collect the gallons per house data, we’re led to believe that the low-income neighbourhoods need to learn to cut back on water consumption through targeted awareness campaigns, low-flow plumbing, or even enforced restrictions.
But what if we changed the unit from per house to per person? Very different story. The residential density is much much higher in the low-income neighbourhoods, with more people living together in less space – a pretty universal phenomenon in towns and cities across the world. If we collect gallons of water per person, it turns out that the people in the more affluent neighbourhood are using nearly twice as much water, not only for bathing, cooking, cleaning and laundry like the other side of town but also keeping their lawns looking great.
What if we looked at water usage per family? Let’s compare the data for two families of the same size: 2 grandparents, 2 parents, 2 adult children and 1 baby. In the dense part of town, this family lives in the same house that they’ve had for years. On the other side of town, the grandparents split their property into two lots when their kids wanted to build next to them, and when their adult son came back from college with a new wife and soon a baby, the family all pitched in to find an affordable property in the same area so they could get some help with childcare. When measured per family, the family split across three houses are using way more water day to day plus keeping up three lawns and the grandma’s prize-winning rose bushes.
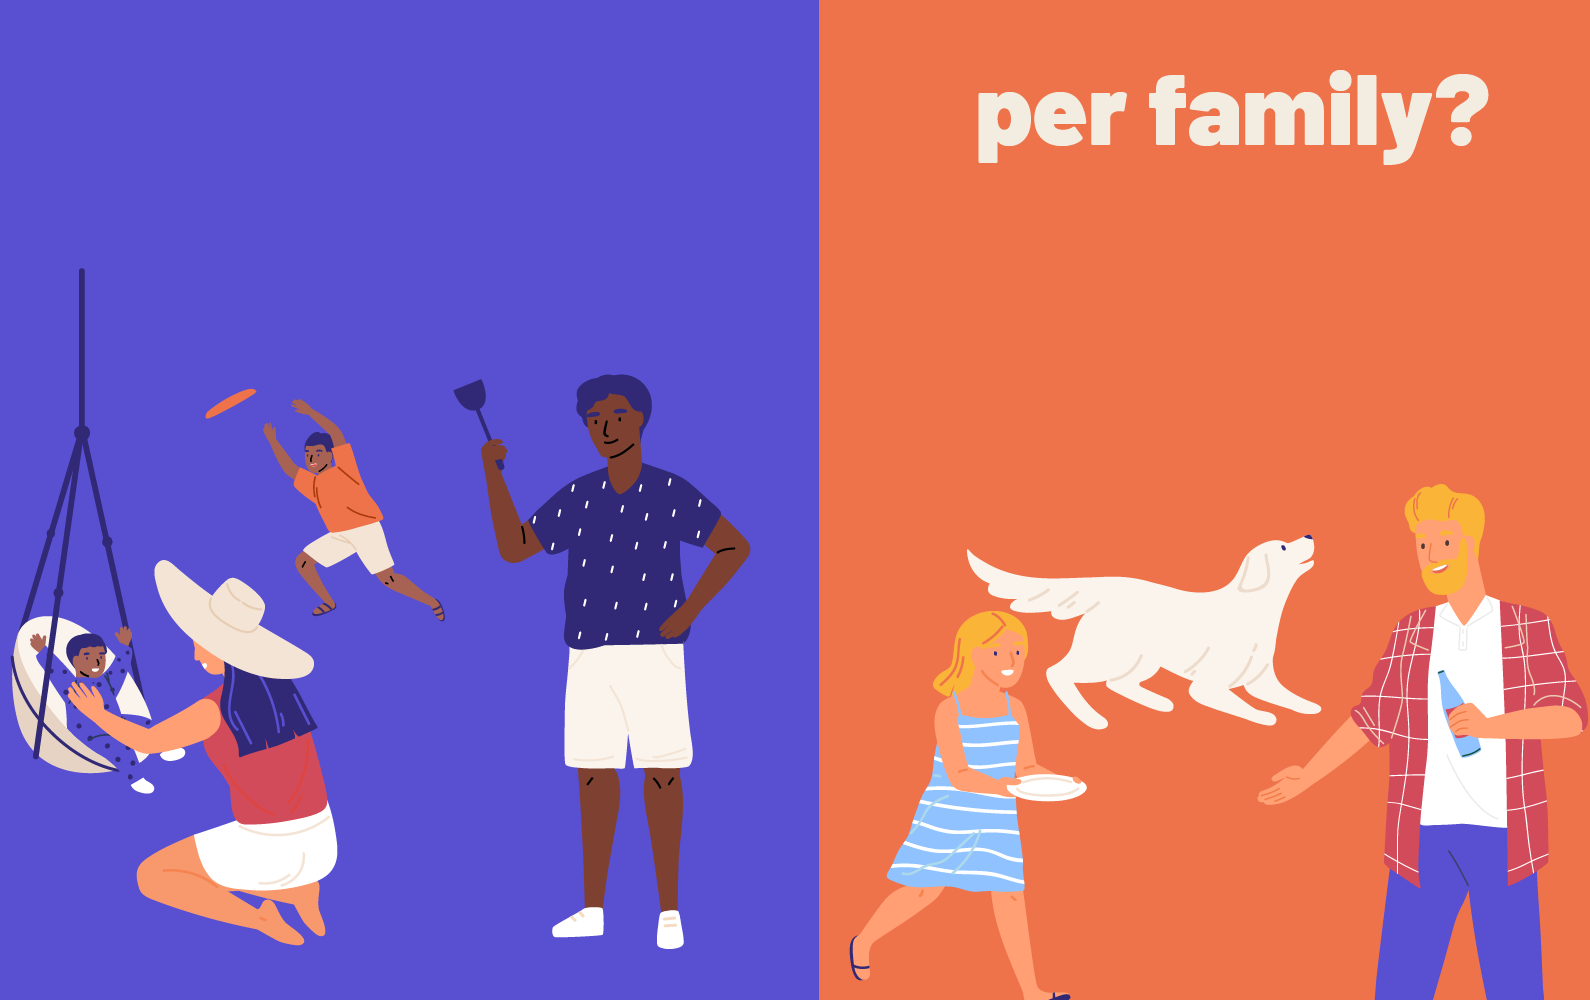

Now, I’m not saying that per person or per family is better than per house. I’m asking who is privileged by measuring this way? The city might be collecting data per house because that is also the unit they use for property taxes, their main source of revenue. The 3-house family is paying 3 houses worth of taxes to be sure.
When we measure, calculate and model our water data using per house it reflects a perspective: that everyone can have as much water as properties they can afford. If our city was trying to find out how much water it needed to ration for each of its citizens, it would need to use a totally different denominator or unit of analysis.